. 2007 Apr;27(8):3065-86.
doi: 10.1128/MCB.01084-06. Epub 2007 Feb 16.

Effect of 21 different nitrogen sources on global gene expression in the yeast Saccharomyces cerevisiae

Affiliations

Effect of 21 different nitrogen sources on global gene expression in the yeast Saccharomyces cerevisiae

Patrice Godard et al. Mol Cell Biol. 2007 Apr.

Abstract

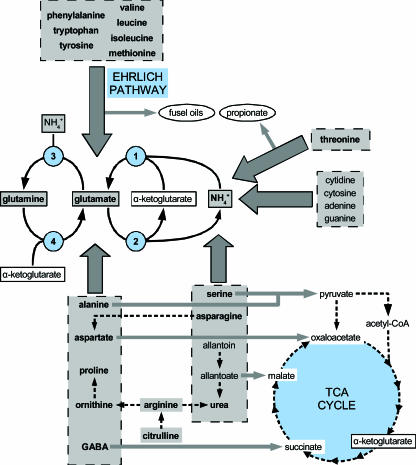
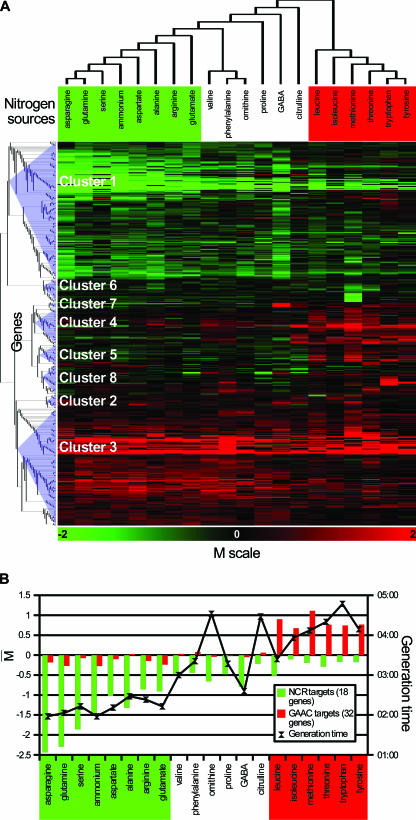
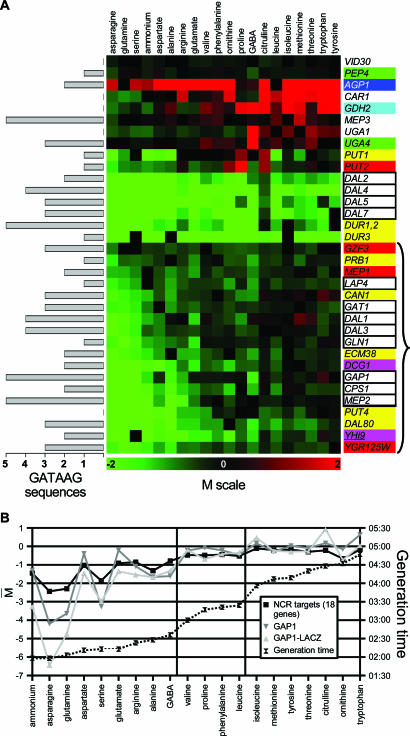
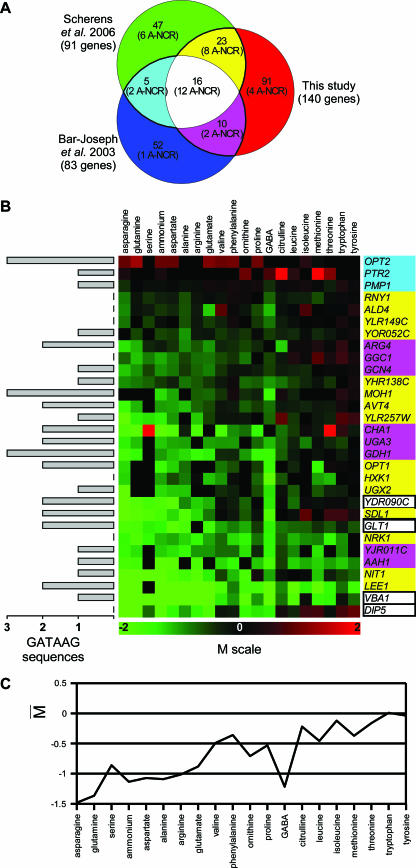
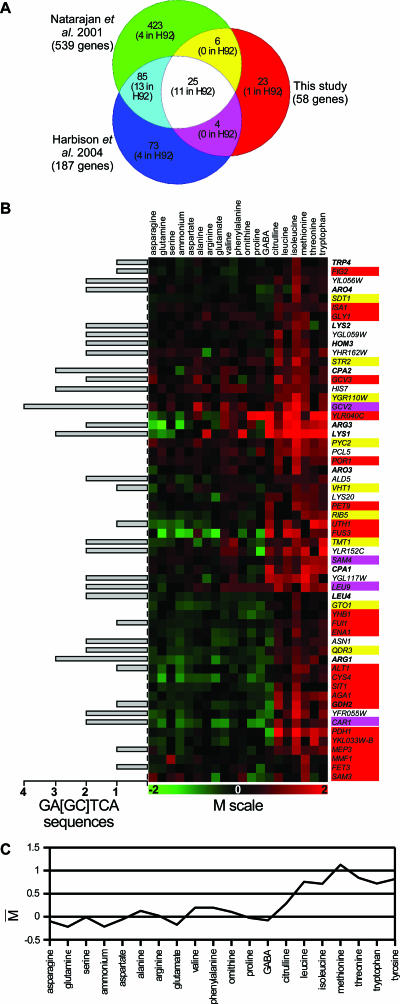
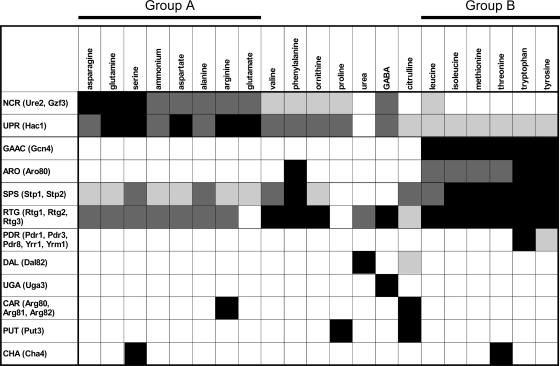
We compared the transcriptomes of Saccharomyces cerevisiae cells growing under steady-state conditions on 21 unique sources of nitrogen. We found 506 genes differentially regulated by nitrogen and estimated the activation degrees of all identified nitrogen-responding transcriptional controls according to the nitrogen source. One main group of nitrogenous compounds supports fast growth and a highly active nitrogen catabolite repression (NCR) control. Catabolism of these compounds typically yields carbon derivatives directly assimilable by a cell's metabolism. Another group of nitrogen compounds supports slower growth, is associated with excretion by cells of nonmetabolizable carbon compounds such as fusel oils, and is characterized by activation of the general control of amino acid biosynthesis (GAAC). Furthermore, NCR and GAAC appear interlinked, since expression of the GCN4 gene encoding the transcription factor that mediates GAAC is subject to NCR. We also observed that several transcriptional-regulation systems are active under a wider range of nitrogen supply conditions than anticipated. Other transcriptional-regulation systems acting on genes not involved in nitrogen metabolism, e.g., the pleiotropic-drug resistance and the unfolded-protein response systems, also respond to nitrogen. We have completed the lists of target genes of several nitrogen-sensitive regulons and have used sequence comparison tools to propose functions for about 20 orphan genes. Similar studies conducted for other nutrients should provide a more complete view of alternative metabolic pathways in yeast and contribute to the attribution of functions to many other orphan genes.


Figures

FIG. 1.
FIG. 1.
Main reactions involved in the utilization of nitrogen sources in the yeast S. cerevisiae. The nitrogenous compounds indicated in gray boxes are the 27 nitrogen sources utilizable by the yeast S. cerevisiae. Those tested in this study are indicated in bold. Thick gray arrows represent the catabolic pathways leading to either ammonium or glutamate, and narrower arrows point to carbonaceous products resulting from these catabolic pathways. Among these compounds, those which cannot be metabolized by the cell are circled. The enzymatic reactions involved in the central pathway of nitrogen metabolism and associating ammonium, glutamate, and glutamine are also indicated and correspond to the anabolic NADPH glutamate dehydrogenase Gdh1 (1), the catabolic NAD+ glutamate dehydrogenase Gdh2 (2), the glutamine synthetase Gln1 (3), and the glutamate synthase Glt1 (4). TCA cycle, tricarboxylic acid cycle; CoA, coenzyme A.
FIG. 2.
FIG. 2.
Transcriptome-based classification of nitrogen supply conditions and status of wide-spectrum nitrogen transcriptional regulations. (A) Classification of nitrogen sources. The tree was obtained by applying a hierarchical clustering method (metric, average dot product; method, complete linkage) to the expression data obtained for 390 of the nitrogen-regulated genes (see the text). Group A and group B nitrogen sources are indicated in green and red, respectively. The lower part of the figure shows the expression profiles of the 390 nitrogen-regulated genes subdivided into 8 clusters (see the text). The M value of each gene (see details below and in Materials and Methods) on each tested nitrogen source is shown in a green-to-red color code system, in which M values above 0 are in red, values below 0 are in green, and values equal to 0 or not determined are in black. (B) Influence of the nitrogen source on the generation time (in hours) of yeast cells and on the average expression of genes subject to NCR or to general GAAC. The thick black line indicates the generation time of strain Σ1278b on the different nitrogen media. Bars indicate the means of M values obtained for two sets of genes. One (in green) corresponds to 18 genes known to be mainly regulated by the NCR circuit (see the text). The other corresponds to 32 genes defined as being under Gcn4 control (90). Group A nitrogen sources are indicated in green and group B nitrogen sources in red.
FIG. 3.
FIG. 3.
Influence of nitrogen on the expression of known NCR target genes. (A) Expression profiles of 34 of the 41 A-NCR genes (see the text). The color code of the genes is the same as that used in the Venn diagram presented in Fig. 4A. The M value of each gene (see the details in the legend of Fig. 2 and under Materials and Methods) on each tested nitrogen source is shown in the green-to-red color code system used in Fig. 2. The nitrogen sources are sorted according to the classification presented in Fig. 2A. The left part of the figure indicates the number of 5′-GATAAG-3′ sequences found in the 800-bp upstream region of each gene. The brace corresponds to the 18 genes solely regulated by NCR. (B) Influence of the nitrogen source on the degree of NCR. The dotted line represents the Σ1278b strain's generation times on the different nitrogen sources. The black line marked with black squares represents the means of M values (see the details in the legend of Fig. 2 and under Materials and Methods) for the 18 genes known to be regulated mainly by NCR (A-NCR genes [see the text]). The dark-gray line marked with inverted triangles represents the M values obtained for the GAP1 gene alone in our expression data. The light-gray line marked with triangles represents the log2 ratio of the β-galactosidase activities measured on each nitrogen medium to those on urea in wild-type strain 23344c transformed with a centromere-based plasmid bearing a GAP1-lacZ fusion. The nitrogen sources are sorted by the increasing generation time of strain Σ1278b.
FIG. 4.
FIG. 4.
Identification of additional P-NCR target genes. (A) Venn diagram showing the numbers of NCR target genes found in common in our study (140 genes [see the text]) and/or in two other genome-wide studies (7, 112). Thick black lines delimit the groups of genes belonging to at least two lists. The number of A-NCR genes included in each section of the diagram is also indicated. (B) Expression profiles of 30 highly P-NCR target genes (see the text). The P-NCR genes shown here are those belonging to at least two of the gene lists presented in panel A and which are not A-NCR genes. The color code of the genes is the same as that used in the Venn diagram presented in panel A. The M values and the numbers of GATAAG sequences are indicated as for Fig. 2A and 3A, respectively. (C) Influence of the nitrogen source on the expression levels (average of M values as described in the legend of Fig. 2B) of the 30 P-NCR genes shown in panel B. The nitrogen sources are sorted according to the classification presented in Fig. 2A.
FIG. 5.
FIG. 5.
Influence of nitrogen on the expression of genes subject to GAAC. (A) Venn diagram showing the numbers of genes found in common in our study's clusters 4 and 5 of coregulated genes (58 genes [see the text]), in the list of genes found to be associated with the Gcn4 transcription factor (53), and/or in the list of Gcn4 target genes obtained by transcriptome analysis (90). For each section of the diagram, the number of Gcn4 target genes (H92) originally identified by classical molecular genetic studies (57) is indicated. (B) Expression profile of the 58 genes of clusters 4 and 5. The color code associated with the gene names comes from the Venn diagram presented in panel A. The genes indicated in bold are those classically known as GAAC targets, as reviewed in reference . The M value and its color code are as described for previous figures. A schematic of the number of 5′-GA[GC]TCA-3′ sequences found in the 800-bp upstream region of each of the 55 genes is indicated on the left. (C) Influence of nitrogen on the expression levels (averages of M values, as described for Fig. 2B) of the 58 genes shown in panel B. The nitrogen sources are sorted according to the classification presented in Fig. 2A.
FIG. 6.
FIG. 6.
The GCN2 gene is required for optimal growth on group B nitrogen sources. Strains 23344c (wild type [wt]) and JA766 (gcn2Δ) were streaked onto a solid minimal medium containing a single amino acid as the sole nitrogen source at the indicated concentration. The pictures were taken after 4 days of growth.
FIG. 7.
FIG. 7.
Many yeast genes are more highly expressed on most tested nitrogen sources than on urea. Influence of the nitrogen source on the expression levels (averages of M values, as described for Fig. 2B) of four subclusters of coregulated genes (see the text). The nitrogen sources are sorted according to the result of the classification presented in Fig. 2A.
FIG. 8.
FIG. 8.
Identification of novel target genes of the ARO and UGA regulons. (A) Verification by qRT-PCR that the ESBP6 and ARO80 genes are induced by aromatic amino acids in an Aro80-dependent manner. The relative amounts of the mRNA of each gene and of ARO9 used as a control were monitored by qRT-PCR analysis of wild-type (23344c; wt) and aro80-2 (IHI606) strains grown on urea with or without the addition for 1 hour of tryptophan, tyrosine, or phenylalanine (final concentration, 5 mM). The values were normalized with respect to the ACT1 reference gene. For each gene the mean M value is shown with its standard deviation. (B) Verification by qRT-PCR that the MAE1 and AMD2 genes are induced by GABA in a Uga3-dependent manner. The relative amounts of each gene transcript and of UGA4 mRNA used as a control were monitored and calculated as described for panel A in wild-type (23344c) and uga3 (26970a) strains grown on urea with or without the addition for 1 hour of GABA (final concentration, 5 mM).
FIG. 9.
FIG. 9.
Influence of the nitrogen medium on the status of nitrogen-sensitive transcriptional controls. The average levels of expression of the target genes of each indicated regulon were calculated and used to evaluate the degree of activation of the corresponding transcriptional controls (see the text and previous figures). For simplicity's sake, we have defined four degrees of activation: highly active (black squares), moderately active (dark-gray squares), slightly active (light-gray squares), and inactive (white squares). Nitrogen sources are sorted according to the classification presented in Fig. 2A. The activation of transcriptional regulation generally leads to up-regulation of the corresponding target gene. NCR, however, is an exception; in the presence of a good nitrogen source, NCR is active, and this results in the lack of activation of the genes under the positive control of the Gln3 and Gat1/Nil1 transcription factors. ARO, specific induction of genes involved in aromatic amino acid catabolism; SPS, response to extracellular amino acids via the SPS system (Ssy1-Ptr3-Ssy5); PDR, response to drugs; DAL, specific induction of genes involved in allantoin, allantoate, and urea catabolism; UGA, specific induction of genes involved in GABA catabolism; CAR, specific induction of genes involved in arginine catabolism; PUT, specific induction of genes involved in proline catabolism; CHA, specific induction of genes involved in serine and threonine catabolism.

Similar articles

Cited by

References

    1. Abdel-Sater, F., I. Iraqui, A. Urrestarazu, and B. Andre. 2004. The external amino acid signaling pathway promotes activation of Stp1 and Uga35/Dal81 transcription factors for induction of the AGP1 gene in Saccharomyces cerevisiae. Genetics 166:1727-1739. - PMC - PubMed
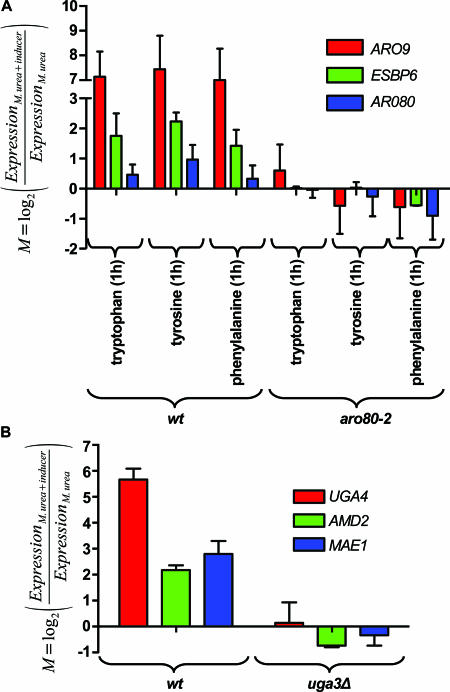
    1. Andre, B. 1990. The UGA3 gene regulating the GABA catabolic pathway in Saccharomyces cerevisiae codes for a putative zinc-finger protein acting on RNA amount. Mol. Gen. Genet. 220:269-276. - PubMed
    1. Andre, B., C. Hein, M. Grenson, and J. C. Jauniaux. 1993. Cloning and expression of the UGA4 gene coding for the inducible GABA-specific transport protein of Saccharomyces cerevisiae. Mol. Gen. Genet. 237:17-25. - PubMed
    1. Andre, B., D. Talibi, S. Soussi Boudekou, C. Hein, S. Vissers, and D. Coornaert. 1995. Two mutually exclusive regulatory systems inhibit UASGATA, a cluster of 5′-GAT(A/T)A-3′ upstream from the UGA4 gene of Saccharomyces cerevisiae. Nucleic Acids Res. 23:558-564. - PMC - PubMed
    1. Andreasson, C., and P. O. Ljungdahl. 2002. Receptor-mediated endoproteolytic activation of two transcription factors in yeast. Genes Dev. 16:3158-3172. - PMC - PubMed

Publication types

MeSH terms