. 2007 Apr 15;55(6):652-62.
doi: 10.1002/glia.20494.

Exocytosis of ATP from astrocyte progenitors modulates spontaneous Ca2+ oscillations and cell migration

Affiliations

Exocytosis of ATP from astrocyte progenitors modulates spontaneous Ca2+ oscillations and cell migration

Katharine Striedinger et al. Glia. .

Abstract

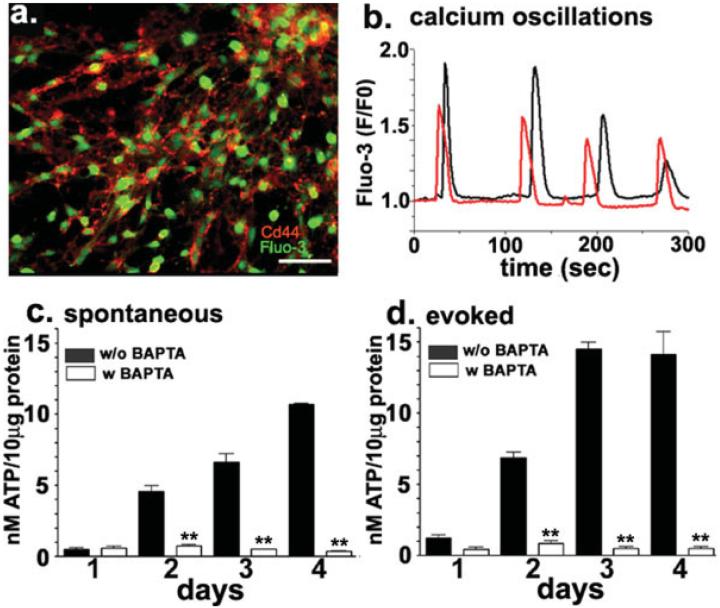
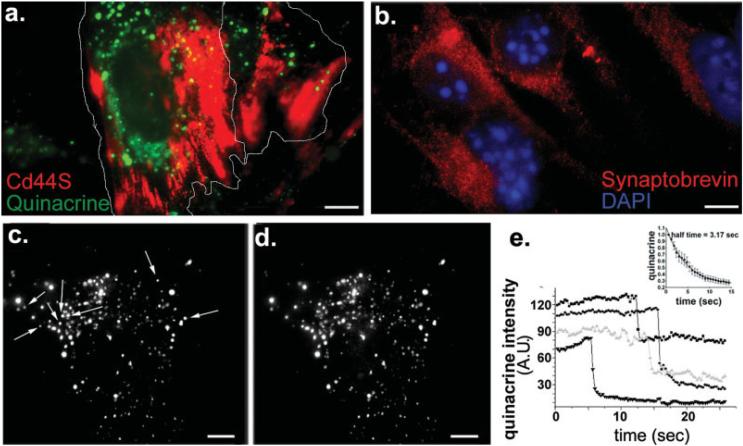
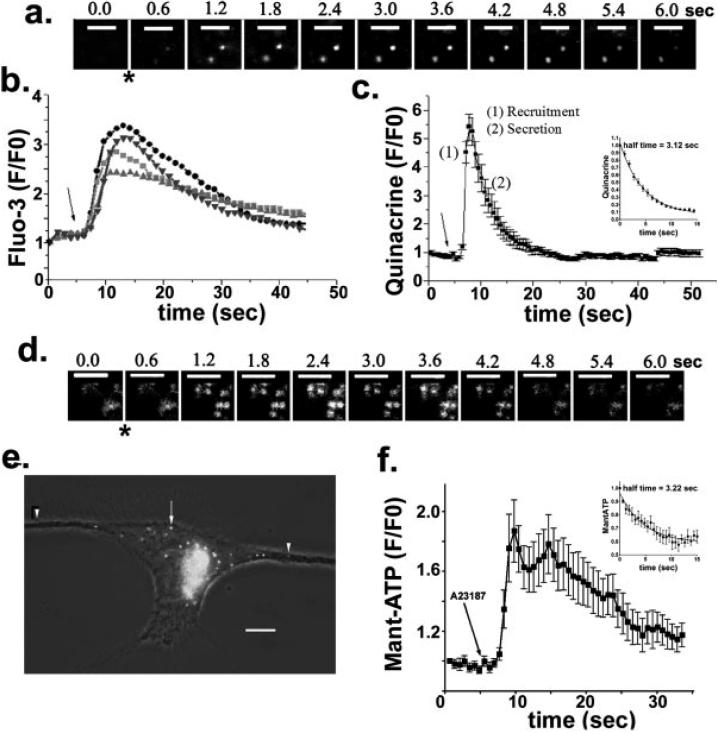
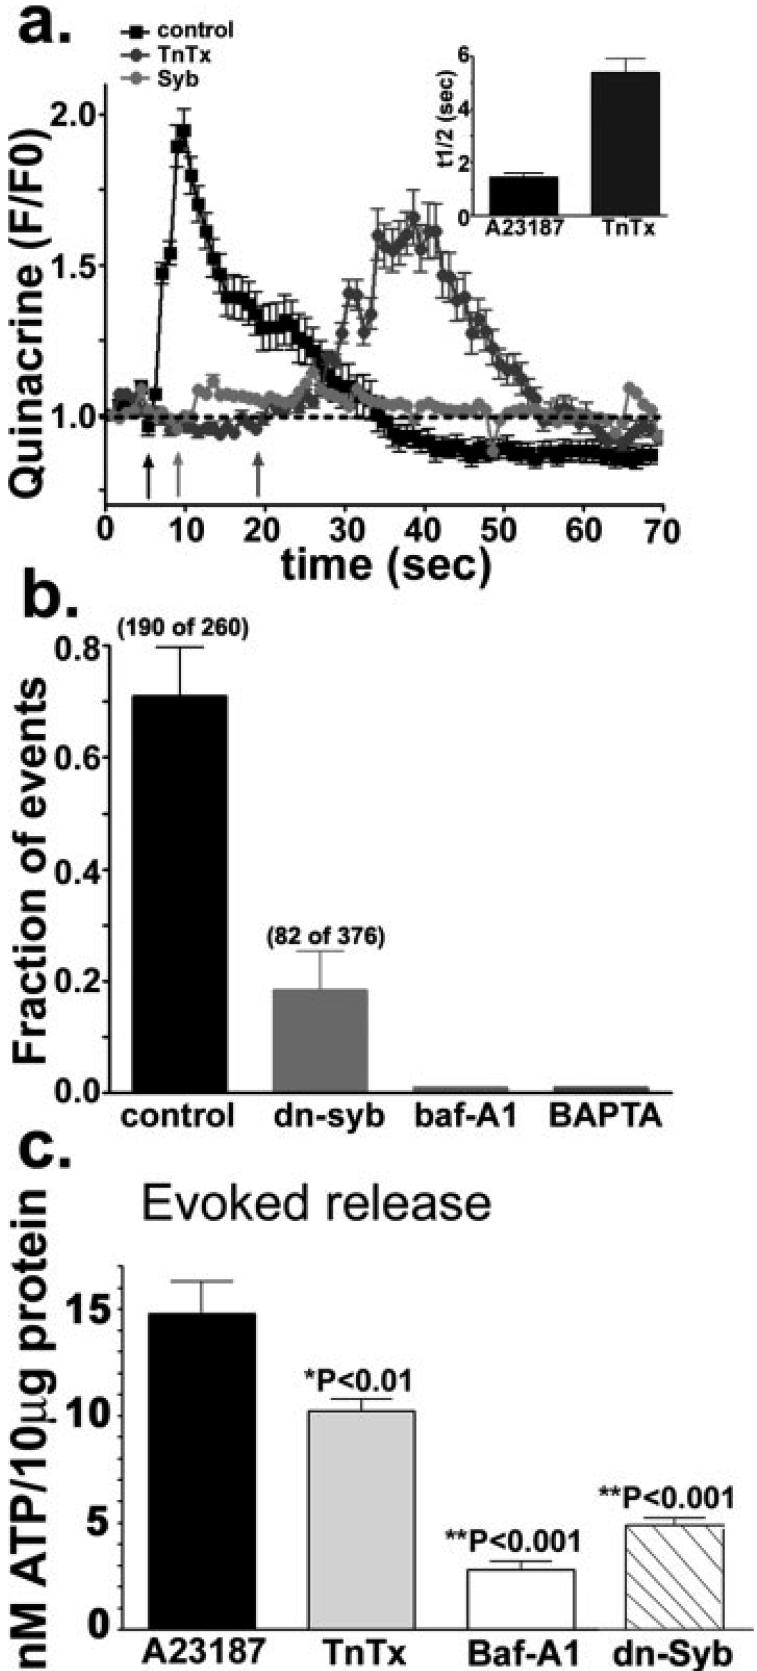
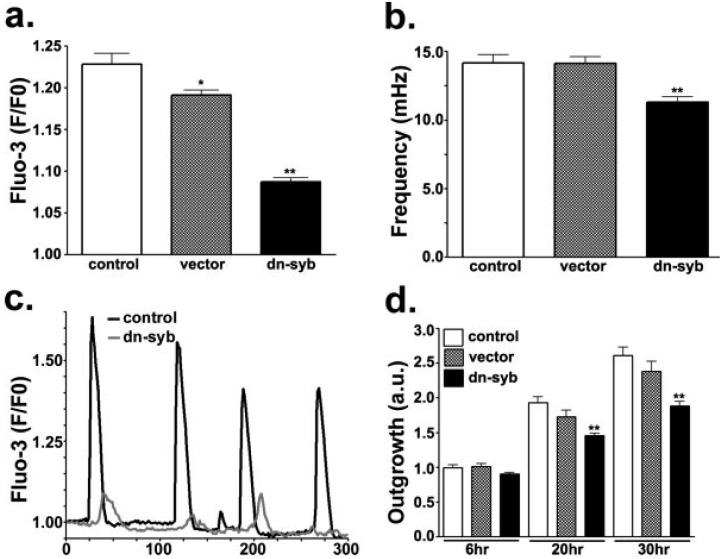
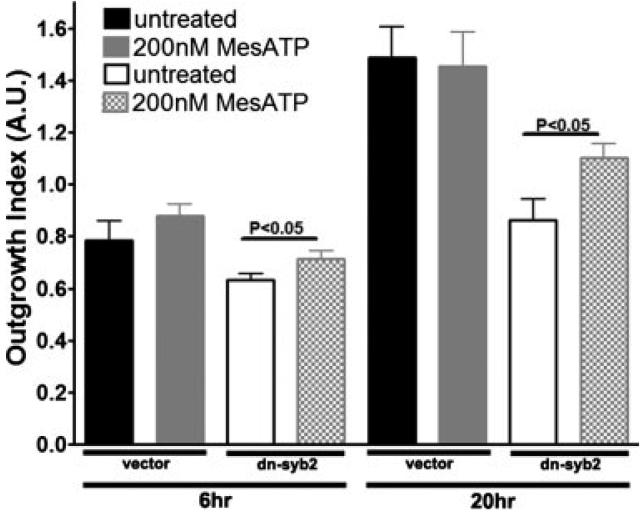
In the mature central nervous system (CNS) regulated secretion of ATP from astrocytes is thought to play a significant role in cell signaling. Whether such a mechanism is also operative in the developing nervous system and, if so, during which stage of development, has not been investigated. We have tackled this question using cells derived from reconstituted neurospheres, as well as brain explants of embryonic mice. Here, we show that in both models of neural cell development, astrocyte progenitors are competent for the regulated secretion of ATP-containing vesicles. We further document that this secretion is dependent on cytosolic Ca(2+) and the v-SNARE system, and takes place by exocytosis. Interference with ATP secretion alters spontaneous Ca(2+) oscillations and migration of neural progenitors. These data indicate that astrocyte progenitors acquire early in development the competence for regulated secretion of ATP, and that this event is implicated in the regulation of at least two cell functions, which are critical for the proper morphogenesis and functional maturation of the CNS.


Figures

Fig. 1
Fig. 1
Spontaneous Ca2+ oscillations and Ca2+-dependent secretion of ATP from astrocyte progenitors. (a) Epifluorescence images of live-immunostained progenitors derived from 4-day adherent neurospheres loaded with the calcium indicator Fluo-3-AM (green) showing the expression of Cd44S (red) in astrocytic precursors. Bar: 10 μm. (b) Examples of spontaneous intracellular Ca2+ oscillations recorded from two Cd44S expressing cells derived from 4-day adherent neurospheres. (c, d) Bar histograms showing the amount of ATP secreted from 1-4 day-adherent progenitors; (c) spontaneous and (d) 10 μM A23187-induced ATP release were measured from control cells (black bars) and from cells loaded with 50 μM Bapta-AM (white bars). Application of the Ca2+ ionophore (d) induced a significant increase in the amount of ATP secreted compared with that released by non-stimulated cells (c) and Bapta greatly reduced both spontaneous and evoked ATP release. ATP measurements were performed using the luciferin-luciferase assay and luminescence values were transformed into [ATP] according to calibration curves performed in the presence and absence of the agents mentioned above, and the values were normalized to the total amount of protein. (**P < 0.001; ANOVA analysis of variance followed by Newman-Keuls' paired test).
Fig. 2
Fig. 2
Quinacrine-containing compartments in astrocyte progenitors. (a) Total internal reflected fluorescence (TIRF) view of quinacrine-containing vesicles (green) in 3-4 day-adherent progenitors (the contour of cells is outlined), immunostained for Cd44S (red). (b) Epifluorescence image showing immunoreactivity for the vSNARE protein synaptobrevin-2. Note the vesicular-like distribution of the endogenous synaptobrevin-2. (c, d) TIRF images of quinacrine-loaded progenitors derived from 3 day-adherent neurospheres. Arrows in (c) indicate some of the quinacrine-containing vesicles that are absent in image (d), which was acquired 1 min later. (e) The intensity of quinacrine fluorescence of vesicles illustrated in panel c-d abruptly decreased at various time points, indicating the spontaneous vesicular release of the tracer. Inset: Time course of the decay of quinacrine fluorescence during the diffusion of quinacrine from vesicles that underwent spontaneous exocytosis. The mean± SEM half-time values of quinacrine diffusion (3.2 s; N = 14 vesicles) was obtained by fitting the equation Y = Ymax exp(-kt), where Y is the change in fluorescence intensity over time (t), Ymax is the maximal fluorescence intensity, and k is the rate constant (half-time is 0.69/k). The absolute values of fluorescence intensity changes were followed from regions of interest comprising quinacrine-positive vesicles present in the first TIRF image (t = 0). The TIRF image displayed in panel a was obtained using a Nikon White Light TIRF system, whereas those displayed in panels c-d were obtained with a laser-TIRF system. Bars: 10 μm.
Fig. 3
Fig. 3
Ca2+-dependent vesicular release of quinacrine and Mant-ATP from astrocyte progenitors. (a) Sequential White Light TIRF images of quinacrine-loaded vesicles showing the time course of exocytotic events induced by bath application (*) of A23187 (10 μM) in 3-day progenitor. Bars: 4 μm. (b, c) Time courses of relative fluorescence intensity (F/F0) changes of Fluo-3 (b) and quinacrine (c) induced by exposure (arrows) of 3 day-adherent progenitors to A23187 (10 μM). After addition of A23187 there is an increase in quinacrine fluorescence because of the recruitment (1) of vesicles at the cell periphery, observed in the evanescent field, followed by a decrease in quinacrine fluorescence as the dye is released (2) from loaded vesicles. Quinacrine fluorescence intensity changes were evaluated from regions of interest with a constant position throughout the series of TIRF images. (d) Sequential 488 nm laser-based TIRF images of Mant-ATP-loaded vesicles showing the time course of exocytosis induced by A23187 (*). Bars: 4 μm. (e) Live epifluorescence image showing vesicles containing Mant-ATP in a 2 day-adherent progenitor cell. Note the presence of small (arrowheads) and large (arrow) vesicles. Image acquired with a SPOT-RT camera attached to an inverted Nikon microscope equipped with a ×100 oil immersion objective (N.A. 1.4) and FITC filter set. Bar: 8.5 μm. (f) Time course of changes in Mant-ATP fluorescence intensity induced by bath application (arrow) of 10 μM A23187, and recorded from 3-day progenitors using 488 nm laser-based TIRF microscopy. Changes in Mant-ATP fluorescence intensity were evaluated in regions of interest that retained a constant position throughout the series of TIRF images. Insets in parts c and f show the time course (mean ± SEM) of quinacrine and Mant-ATP fluorescence, respectively, during the diffusion of the dyes from vesicles that underwent regulated exocytosis. Note the similar half-time values obtained for the diffusion of quinacrine (3.1 s; N = 19 vesicles) and Mant-ATP (3.2 s; N = 10 vesicles). The half-time was obtained by fitting the equation Y = Ymax exp(-kt), where Y is the change in fluorescence intensity over time (t), Ymax is the maximal fluorescence intensity, and k is the rate constant (half-time is 0.69/k).
Fig. 4
Fig. 4
vSNARE-dependent release of quinacrine and ATP. (a) Time course of quinacrine fluorescence intensity (F/F0) changes induced by 10 μM A23187 (arrows) in 3-4 day-adherent untreated (black squares), TnTx-treated (300 nM; dark gray circles) and dn-syb2-transfected (light gray circles) progenitor cells. Inset: Bar histograms show the mean ± SEM values of the half-time (t1/2) of the rising phase of quinacrine fluorescence intensity, defined as the interval between the emergence of quinacrine vesicles into the evanescent field and the moment at which their fluorescence intensity started decreasing, in control and TnTx-treated progenitors. (b) Bar histograms show that the fraction of exocytic events recorded from progenitors transfected with the dominant-negative domain of synaptobrevin-2 (dn-syb) was greatly reduced and that these events were absent in progenitor cells treated with either bafilomycin-A1 (5 lμM; baf-A1) or a calcium chelator (50 lμM; Bapta-AM). (c) The amount of ATP released from 4-day progenitors exposed to the Ca2+-ionophore was significantly reduced by both TnTx (300 nM) and bafilomycin-A1 (5 μM; Baf-A1), and by transfecting the cells with the dominant-negative domain of synaptobrevin-2 (dn-Syb). Values are mean ± SEM. *P < 0.01; **P < 0.001; ANOVA followed by Newman-Keuls' paired test.
Fig. 5
Fig. 5
Regulated secretion of ATP modulates spontaneous Ca2+ oscillations and cell migration. (a, b) Bar histograms show the mean ± SEM values of the amplitude (a) and frequency (b) of spontaneous Ca2+ oscillations recorded from control, 2 day-adherent progenitors (white bars), progenitors transfected with an empty vector (gray bars) and progenitors transfected with a dominant-negative domain of synaptobrevin-2 (dn-syb; black bars). Note the slight reduction in frequency (b) and the dramatic decrease in the amplitude (a) of spontaneous Ca2+ oscillations in the dn-syb transfectants. (c) Spontaneous Ca2+ oscillations recorded from Fluo-3-AM-loaded control progenitors (black trace) and progenitors transfected with the dn-syb2 (gray trace). (d) Bar histograms show the mean ± SEM values of outgrowth index (OI) obtained from progenitors derived from control neurospheres (white bars), neurospheres transfected with an empty vector (gray bars) and neurospheres transfected for dn-syb2 (black bars). Meaurements were performed 6-30 h after adhesion of neurospheres to fibronectin-coated dishes. Note that the OI of dn-syb transfectants was significantly decreased compared with that of both control and empty vector-transfected cells. *P < 0.01; **P < 0.001; ANOVA followed by Newman-Keuls' paired test.
Fig. 6
Fig. 6
P2Y1 receptor activation increases migration of dn-syb2-expressing progenitor cells. Bar histograms show the mean ± SEM values of outgrowth index (OI) from progenitors derived from mock (empty-vector) and dn-syb2 transfected neurospheres before (black and white bars, respectively) and after exposure to 200 nM MeSATP (gray and cross-hatched bars, respectively). Measurements were performed 6-30 h after adhesion of neurospheres to fibronectin-coated dishes. Note the significant OI increase in dn-syb2 transfectants treated with MeSATP compared with untreated dn-syb2 transfectants. *P < 0.05; t-test.

Similar articles

Cited by

References

    1. Abbracchio MP. ATP and brain function. In: Jacobson KA, Jarvis MF, editors. Purinergic approaches in experimental therapeutics. Willey-Liss; New York: 1997. pp. 383–404.
    1. Abdipranoto A, Liu GJ, Werry EL, Bennett MR. Mechanisms of secretion of ATP from cortical astrocytes triggered by uridine triphosphate. Neuroreport. 2003;14:2177–2181. - PubMed
    1. Agresti C, Meomartini ME, Amadio S, Ambrosini E, Serafini B, Franchini L, Volonte C, Aloisi F, Visentin S. Metabotropic P2 receptor activation regulates oligodendrocyte progenitor migration and development. Glia. 2005;50:132–144. - PubMed
    1. Aguado F, Espinosa-Parrilla JF, Carmona MA, Sorian E. Neuronal activity regulates correlated network properties of spontaneous calcium transients in astrocytes in situ. J Neurosci. 2002;22:9430–9444. - PMC - PubMed
    1. Ahnert-Hilger G, Bigalke H. Molecular aspects of tetanus and botulin neurotoxin poisoning. Prog Neurobiol. 1995;46:83–96. - PubMed

Publication types