. 2007 Mar 14;129(10):2914-22.
doi: 10.1021/ja067606t. Epub 2007 Feb 20.

Biosynthesis of thiamin thiazole in eukaryotes: conversion of NAD to an advanced intermediate

Affiliations

Biosynthesis of thiamin thiazole in eukaryotes: conversion of NAD to an advanced intermediate

Abhishek Chatterjee et al. J Am Chem Soc. .

Abstract

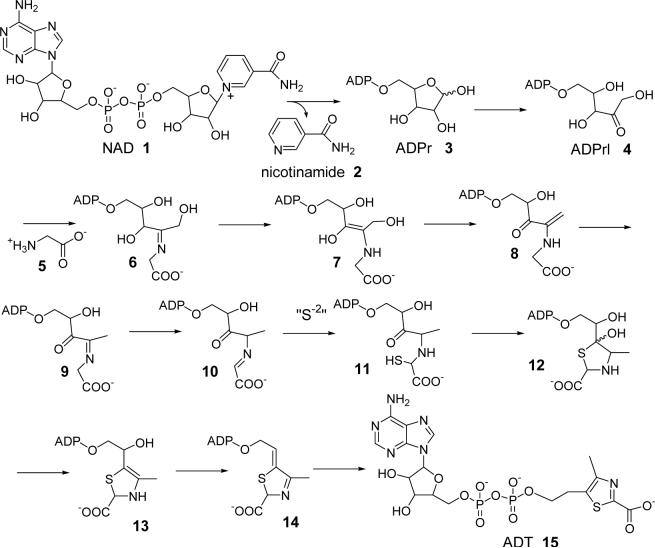
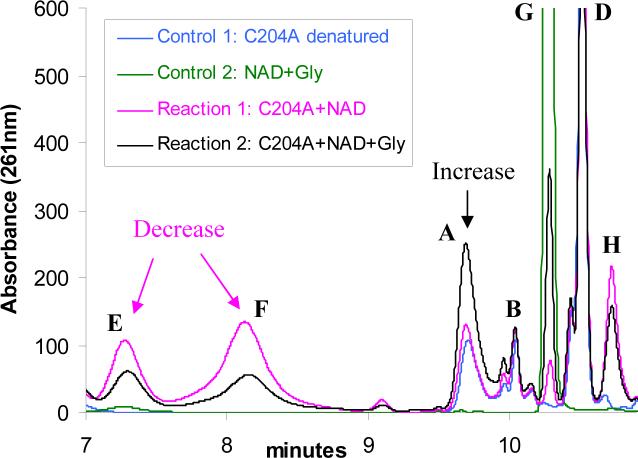
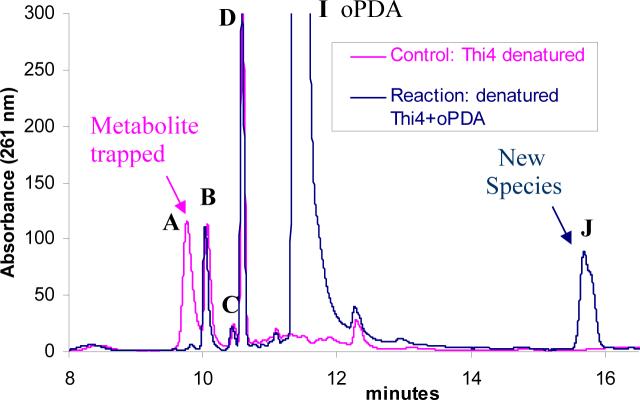
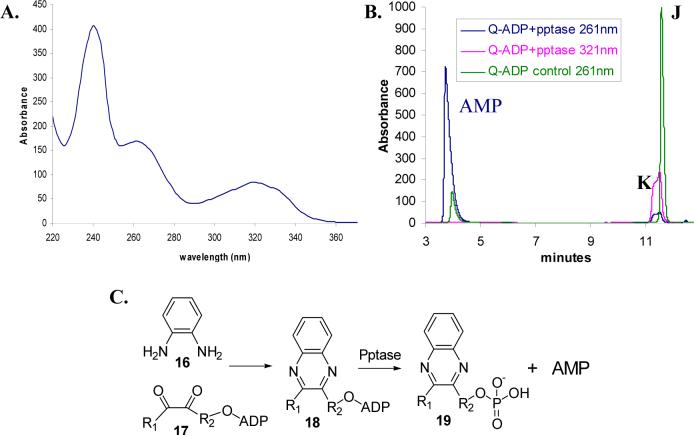
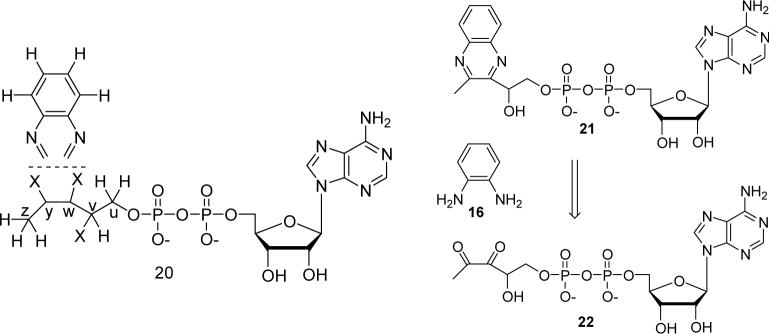
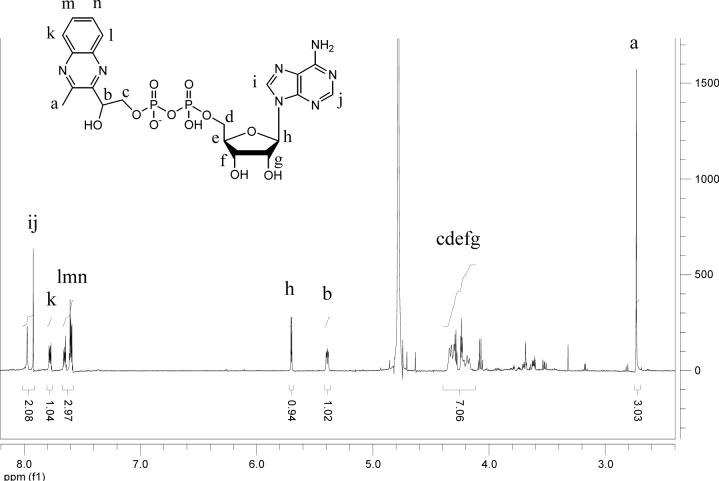
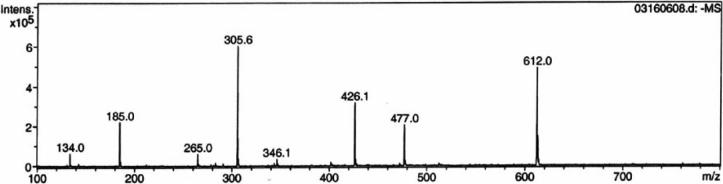
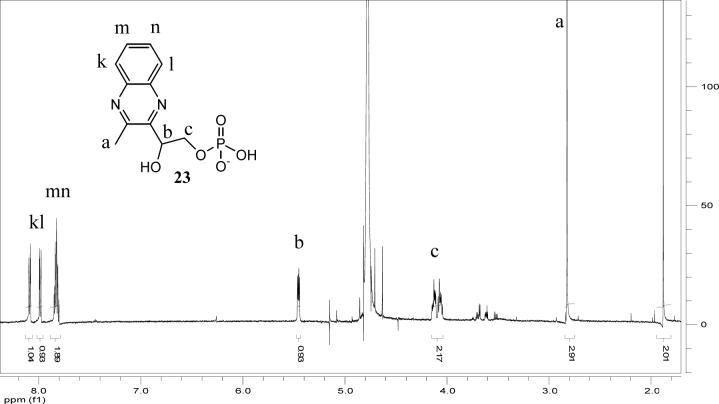
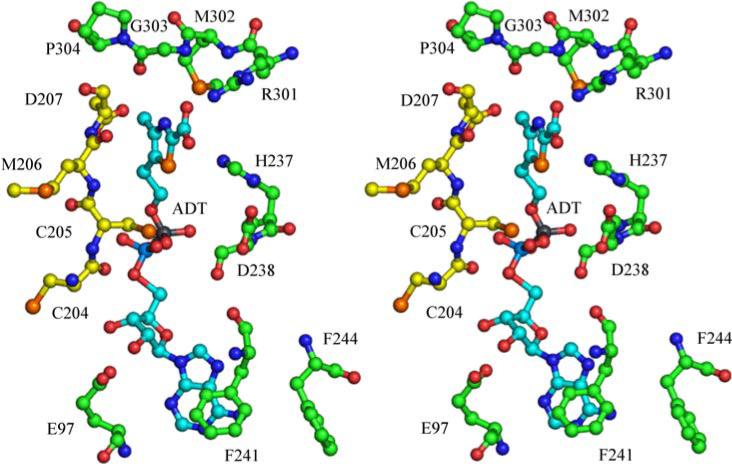
Thiazole synthase catalyzes the formation of the thiazole moiety of thiamin pyrophosphate. The enzyme from Saccharomyces cerevisiae (THI4) copurifies with a set of strongly bound adenylated metabolites. One of them has been characterized as the ADP adduct of 5-(2-hydroxyethyl)-4-methylthiazole-2-carboxylic acid. Attempts toward yielding active wild-type THI4 by releasing protein-bound metabolites have failed so far. Here, we describe the identification and characterization of two partially active mutants (C204A and H200N) of THI4. Both mutants catalyzed the release of the nicotinamide moiety from NAD to produce ADP-ribose, which was further converted to ADP-ribulose. In the presence of glycine, both the mutants catalyzed the formation of an advanced intermediate. The intermediate was trapped with ortho-phenylenediamine, yielding a stable quinoxaline derivative, which was characterized by NMR spectroscopy and ESI-MS. These observations confirm NAD as the substrate for THI4 and elucidate the early steps of this unique biosynthesis of the thiazole moiety of thiamin in eukaryotes.


Figures

Figure 1
Figure 1
Mechanistic proposal for the THI4 catalyzed formation of ADT, 15 (Peak D, Figure 2)
Figure 2
Figure 2
Metabolites associated with THI4 that are released upon denaturing the protein. Peak D is ADT (15). Peaks A and B were unstable and degraded during the isolation process.
Figure 3
Figure 3
Conversion of NAD (1, peak G) to ADPr (3, peak E), nicotinamide (2, peak H) and an unknown species (peak F) catalyzed by the partially active mutant C204A. Reaction 1 represents the HPLC analysis of the reaction mixture containing the mutant C204A and NAD. Control 1 represents an experiment where the mutant C204A, with no NAD, was treated identically as reaction 1. It represents the protein bound small molecules (A, B and D). Control 2 represents an enzyme free reaction mixture where NAD was incubated in the same reaction buffer and was treated identically as for reaction 1. The condition (heat) applied to denature the protein causes minor hydrolysis of NAD to produce ADPr and nicotinamide. The ADPr and the nicotinamide peaks were identified by co-migration with ADPr and nicotinamide standards.
Figure 4
Figure 4
Conversion of ADP-ribose (3, peak E) to ADP-ribulose (4, peak F) catalyzed by THI4 C204A mutant and ribose-5-phosphate isomerase (RPi). Reaction 1 and 2 represent the reactions of ADP-ribose catalyzed by the RPi and C204A respectively. Control 1 represents a sample of the C204A THI4 protein which was denatured and analyzed for bound metabolites. It shows the enzyme bound metabolites A, B, C and D. Control 2 shows the ADP-ribose control where ADP-ribose was incubated with the same reaction buffer and treated identically as reaction 1 and 2.
Figure 5
Figure 5
The C204A mediated conversion of NAD (1, peak G) to the protein bound metabolite A, in the presence of glycine 5. HPLC chromatograms: Reaction 1 represents a reaction mixture containing C204A and NAD (no glycine). Reaction 2 represents a reaction mixture containing C204A, NAD and glycine. Control 1 represents the experiment where a sample of C204A was incubated in absence of both NAD and glycine (to reveal protein bound metabolites A, B and D). Control 2 represents the experiment where NAD and glycine were incubated in the same reaction buffer, in the absence of protein, under the same conditions as for reactions 1 and 2. Peaks for ADPr (3, peak E), ADPrl (4, peak F), nicotinamide (2, peak H), NAD (1, peak G) and protein bound molecules (peaks A, B and D) are labeled. The glycine-dependent decrease in the intensity of E and F and a concomitant increase in the intensity of A are illustrated.
Figure 6
Figure 6
Trapping of the THI4-bound metabolite A with oPDA (16, peak I) as a new species J. The blue trace represents the reaction mixture where the metabolites released from THI4 (by heat denaturing) were incubated with an excess of oPDA at room temperature. The purple trace represents a control reaction where oPDA was not added (only THI4 bound metabolites).
Figure 7
Figure 7
A: UV-Vis spectrum of the quinoxaline adduct, J, formed as a result of the trapping of the THI4 bound metabolite A by oPDA, 16 (Peak I, Figure 6). B: The purified peak J compound can be cleaved with nucleotide pyrophosphatase (pptase) to produce AMP and another species K (19) that has only one absorption maximum at 321 nm. The blue and the purple traces represent the same reaction mixture containing the purified quinoxaline adduct J and pptase, observed at 261 nm and 321 nm respectively. The green trace represents a control reaction, where pptase was not added, observed at 261 nm. C: Proposed diketone (or equivalent) trapping with oPDA 16 and pyrophosphate hydrolysis with pptase.
Figure 8
Figure 8
Structure 20 represents the partial structure deduced from the NMR experiments and the observations suggesting the presence of a quinoxaline moiety. The five carbon atoms attached to ADP, derived from ADP-ribose, are labeled as u, v, w, y and z. 21 represents the actual structure deduced from additional negative mode ESI-MS experiments and other observations. The structure 21 must be generated from the 1, 2-diketone containing species 22 (or equivalent) and oPDA (16).
Figure 9
Figure 9
1H NMR spectrum of the purified quinoxaline adduct. The peaks have been assigned as shown in the structure.
Figure 10
Figure 10
Negative mode ESI-MS analysis of the quinoxaline derivative 21. The m/z for the monoanionic species is 612 and for the di-anionic species is 305.6. Peaks with m/z = 477, 426.1, 346.1 and 185 result from the fragmentation of 21 under spraying conditions.
Figure 11
Figure 11
1H NMR spectrum of the HPLC-purified quinoxaline phosphate unit (23) obtained from 21 by its hydrolysis catalyzed by nucleotide pyrophosphatase (pptase).
Figure 12
Figure 12
Stereoview of the active site of THI4 with the ADT (15) carbon atoms labeled in cyan. Two separate monomers contribute to the ADT binding site. Carbon atoms from one monomer are labeled with green and those from the other are labeled in yellow. His200 is on a disordered region and is not shown.

References

    1. Butterworth RF. Thiamin deficiency and brain disorders. Nutr. Res. Rev. 2003;16(2):277–283. - PubMed
    1. Jordan F. Current mechanistic understanding of thiamin diphosphate-dependent enzymatic reactions. Nat. Prod. Rep. 2003;20(2):184–201. - PubMed
    1. Settembre E, Begley TP, Ealick SE. Structural biology of enzymes of the thiamin biosynthesis pathway. Curr. Opin. Struct. Biol. 2003;13(6):739–747. - PubMed
    1. Begley TP, Downs DM, Ealick SE, McLafferty FW, Van Loon APGM, Taylor S, Campobasso N, Chiu H-J, Kinsland C, Reddick JJ, Xi J. Thiamin biosynthesis in prokaryotes. Arch. Microbiol. 1999;171(5):293–300. - PubMed
    1. Spenser ID, White RL. Biosynthesis of vitamin B1 (thiamin): an instance of biochemical diversity. Angew. Chem. Int. Ed. Engl. 1997;36(10):1032–1046.

Publication types

MeSH terms