. 2007 Mar;41(3):320-32.
doi: 10.1016/j.ymeth.2006.08.008.

Single-molecule and population probing of chromatin structure using DNA methyltransferases

Affiliations

Single-molecule and population probing of chromatin structure using DNA methyltransferases

Jessica A Kilgore et al. Methods. 2007 Mar.

Abstract

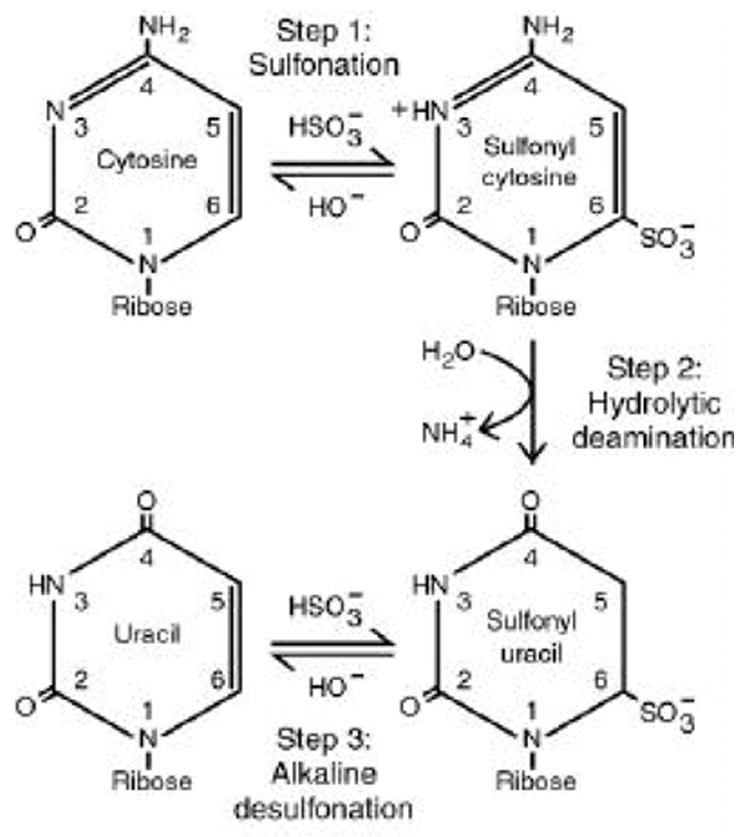
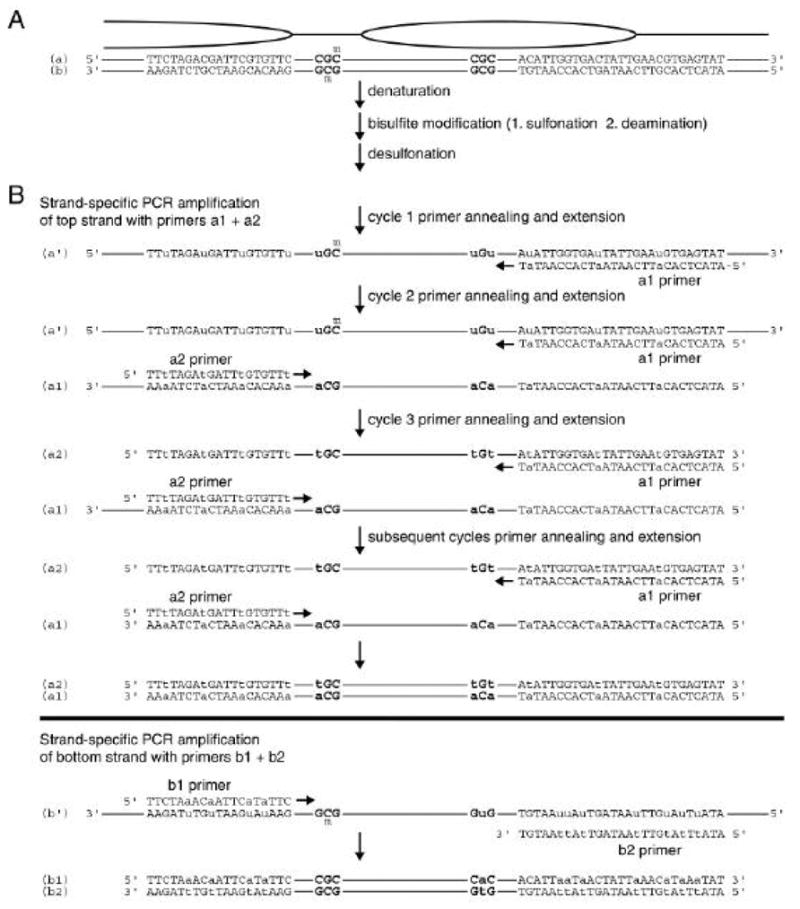
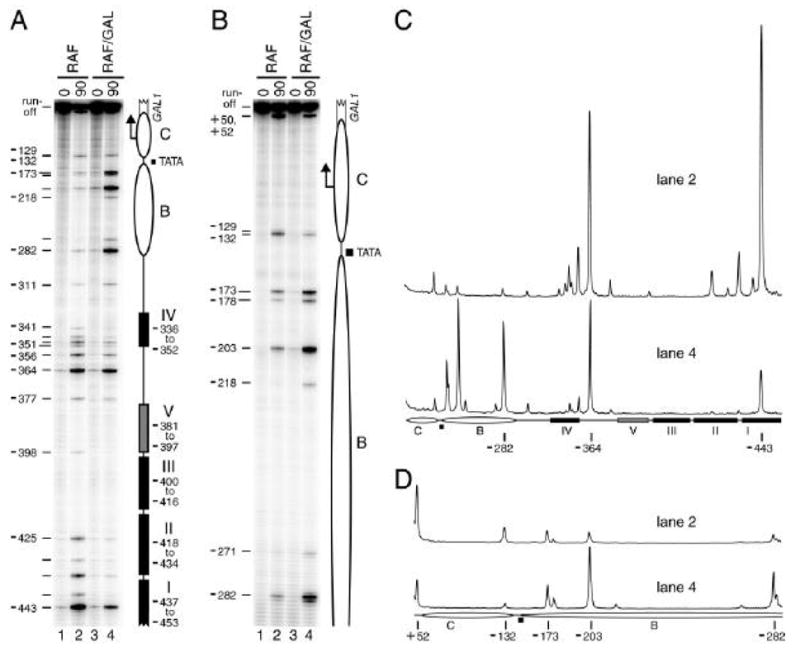
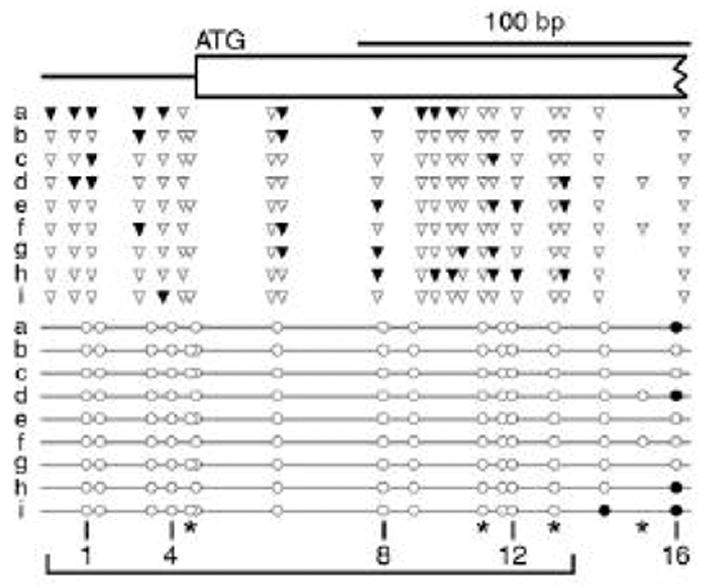
Probing chromatin structure with DNA methyltransferases offers advantages over more commonly used nuclease-based and chromatin immunoprecipitation methods for detection of nucleosomes and non-histone protein-DNA interactions. Here, we describe two related methods in which the readout of MTase accessibility is obtained by assaying 5-methylcytosine in DNA through the PCR-based technique of bisulfite genomic sequencing. The methyltransferase accessibility protocol (MAP) determines the relative frequency at which the enzyme accesses each of its target sites over an entire population of PCR amplified product. While MAP yields much quantitative information about relative accessibility of a region of chromatin, a complementary single-molecule view of methyltransferase accessibility, termed MAP for individual templates (MAP-IT), is provided by analysis of cloned PCR products. Absolute rather than relative methylation frequencies in a region are obtained by summing the methylation status at each site over a cohort of clones. Moreover, as the integrity of individual molecules is maintained in MAP-IT, unique information about the distribution of multiple footprints along continuous regions is gleaned. In principle, the population MAP and single-molecule MAP-IT strategies can be used to analyze chromatin structure in a variety of model systems. Here, we describe the application of MAP in living Saccharomyces cerevisiae cells and MAP-IT in the analysis of a mammalian tumor suppressor gene in nuclei. This application of MAP-IT provides the first means to simultaneously determine CpG methylation of mammalian genes and their overlying chromatin structure in the same single DNA molecule.


Figures

Figure 1
Figure 1
The bisulfite conversion reaction.
Figure 2
Figure 2
Bisulfite conversion and PCR amplification in the BGS procedure. (A) A hypothetical region of chromatin with an accessible, and hence methylated (m), M.CviPI target site (GpC), and an unmodified site where accessibility is hindered by a positioned nucleosome (ellipse). Total genomic DNA is fully denatured to upper (a) and lower (b) strands and subjected to bisulfite conversion, as detailed in Figure 1. (B) Strand-specific PCR amplification of bisulfite-converted DNA. Unmodified cytosines have been deaminated to uracil (lower case in the upper part of each of the two subpanels in B) to yield non-complementary upper (a') and lower (b') DNA strands. Primer pairs ‘a1’ and ‘a2’ or ‘b1’ and ‘b2’ are used to amplify, in separate reactions, the region of interest from the deaminated DNA. The a1 and b1 primers have guanine to adenine (G to a) transitions, whereas the a2 and b2 primers replace cytosine with thymine (C to t). Remaining cytosines are detected by thermal cycle sequencing of the PCR product in the presence of ddGTP using a1 or b1 primers that have been end labeled with 32P (see Methods, Section 2.1.6).
Figure 3
Figure 3
MAP analysis of the non-induced and induced GAL1 promoter. Cells grown under non-inducing (CSM-raffinose, RAF, lanes 1 and 2) or inducing conditions (CSM-raffinose plus galactose, RAF/GAL, lanes 3 and 4) were subsequently left untreated (0 min, lanes 1 and 3) or treated with 100 nM E2 for 90 min to induce M.CviPI synthesis (lanes 2 and 4). The bisulfite sequencing results are shown in the phosphorimages (A, B) or respective quantitative scans (C, D) of the indicated lanes. Improved resolution of bands near the top of the gel in A was obtained by re-extension with an internal primer (i.e. walking) in B. Ellipses, positioned nucleosomes B and C; filled rectangles, Gal4 binding sites I–IV; gray rectangle, Gal4 binding site V (detected previously only by photoaffinity footprinting [43]); filled square, TATA box; bent arrow, major transcription initiation site; and open broken rectangle, GAL1 coding sequence. Nucleotide distances of cytosines in select GpC sites relative to the GAL1 ATG translation start codon are indicated at the left of each phosphorimage and below each pair of scans.
Figure 4
Figure 4
MAP-IT analysis of part of exon 1 of the human SIM2 gene. Nuclei isolated from MCF-10A cells were treated with M.CviPI followed by BGS of sequences encompassing +1,209 to +1,389 relative to the SIM2 transcription initiation site. Nine independent clones from the PCR amplicon (lettered a–i) were sequenced to determine the methylation status of all sites for both endogenous MTases (CpGs, circles) and M.CviPI (GpCs, triangles). Methylated and unmethylated residues are indicated by filled and open symbols, respectively. Methylated cytosines in GpCpG sites (marked by asterisks) are omitted, as modification cannot be unequivocally ascribed to endogenous MTases or M.CviPI. A proposed open region from +1,209 to +1,318 is bracketed. The SIM2 exon 1 sequence is represented as a broken rectangle.

References

    1. Gottschling DE. Proc Natl Acad Sci USA. 1992;89:4062–4065. - PMC - PubMed
    1. Singh J, Klar AJS. Genes Dev. 1992;6:186–196. - PubMed
    1. Kladde MP, Xu M, Simpson RT. EMBO J. 1996;15:6290–6300. - PMC - PubMed
    1. Xu M, Simpson RT, Kladde MP. Mol Cell Biol. 1998;18:1201–1212. - PMC - PubMed
    1. Carvin CD, Dhasarathy A, Friesenhahn LB, Jessen WJ, Kladde MP. Proc Natl Acad Sci USA. 2003;100:7743–7748. - PMC - PubMed

MeSH terms