. 2007 Apr 20;282(16):12154-63.
doi: 10.1074/jbc.M611071200. Epub 2007 Feb 19.

Common structural requirements for heptahelical domain function in class A and class C G protein-coupled receptors

Affiliations

Common structural requirements for heptahelical domain function in class A and class C G protein-coupled receptors

Virginie Binet et al. J Biol Chem. .

Abstract

G protein-coupled receptors (GPCRs) are key players in cell communication. Several classes of such receptors have been identified. Although all GPCRs possess a heptahelical domain directly activating G proteins, important structural and sequence differences within receptors from different classes suggested distinct activation mechanisms. Here we show that highly conserved charged residues likely involved in an interaction network between transmembrane domains (TM) 3 and 6 at the cytoplasmic side of class C GPCRs are critical for activation of the gamma-aminobutyric acid type B receptor. Indeed, the loss of function resulting from the mutation of the conserved lysine residue into aspartate or glutamate in the TM3 of gamma-aminobutyric acid type B(2) can be partly rescued by mutating the conserved acidic residue of TM6 into either lysine or arginine. In addition, mutation of the conserved lysine into an acidic residue leads to a nonfunctional receptor that displays a high agonist affinity. This is reminiscent of a similar ionic network that constitutes a lock stabilizing the inactive state of many class A rhodopsin-like GPCRs. These data reveal that despite their original structure, class C GPCRs share with class A receptors at least some common structural feature controlling G protein activation.


Figures

Fig. 1
Fig. 1
Alignment of the sequences of class C GPCRs. Three conserved residues at the cytoplasmic face of TM3 and TM6 were chosen, as their positions are close to the positions of the D/ERY and D/E motifs in TM3 and TM6 rhodopsin, respectively. The notation of most of the sequences are after the SwissProt data bank notation, with the following accession numbers: MGR5_RAT P31424, MGR1_RAT P23385, MGR1_CAEEL Q09630, MGR_DROME P91685, MGR7_RAT P35400, MGR6_RAT P35349, MGR8_RAT P70579, CASR_MOUSE Q9QY96, TS1R1_RAT Q9Z0R8, GABR1_RAT Q9Z0U4, GABR2_RAT O88871, and OPSD_BOVIN P02699. AAK13420 and AAK13421 sequence, that are GABAB subunits homologues from drosophila, are notated after their gene bank names.
Fig. 2
Fig. 2
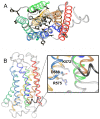
Molecular modeling of GABAB2. A. The side chains of the residues conserved in the GABAB subunits from different species (rat, human, coenorhabditis elegans, and drosophila melanogaster) are showed in black. The representation of the model is viewed from the extracellular side, with the helical TMs showed in ribbon representation. B. The residues K572 and R575 in TM3, and D688 in TM6, are shown in wireframe and in color according to the atom types. The two cysteins conserved in the class C receptors and corresponding to the conserved cysteins in class A receptors involved in a disulfide bridge at the extracellular face are also showed. The representation of the model is viewed from the side and shows the helical TMs in ribbon representation. Loops are shown in white/grey, while TMs are colored as following: TM1 in red, TM2 in brown, TM3 in orange, TM4 in green, TM5 in dark green, TM6 in cyan, and TM7 in dark blue. The figures have been made using the program ViTO.
Fig. 3
Fig. 3
Expression at the cell surface and functional assay of the receptors containing a mutated GABAB2 subunit. A. The cell surface expression of the receptors was analyzed using an ELISA method on intact cells and by detecting the presence of the GABAB1 subunit tagged at its extracellular end by a HA epitope. As GABAB1 reaches the cell surface only when associated with GABAB2, the detection of the GABAB1 at the cell surface indicates that GABAB2 was folded and able to interact correctly with GABAB1 and to take it to the cell surface. The data are the means ± sem of at least three independent experiments performed in triplicates. B. In functional assays, the ligand-induced activity of the mutated receptors was assayed by quantifying the accumulating InP second messenger molecules formed upon activation of the receptors by GABA 1mM. To get coupled to the InP pathway, the GABAB receptor is expressed with the Gqi9 chimeric G protein (see Material and Methods). The data are the means ± sem of at least four independent experiments performed in triplicates.
Fig. 4
Fig. 4
Expression at the cell surface and functional assay of the receptors containing a mutated GABAB1 subunit. A. The cell surface expression of the receptors was analyzed using an ELISA method on intact cells as described in figure 3. The data are the means ± sem of at least three independent experiments performed in triplicates. B. The ligand-induced activity of the mutated receptors was measured as described in figure 3. The data are the means ± sem of at least for independent experiments performed in triplicates.
Fig. 5
Fig. 5
Expression at the cell surface and functional assay of the receptors containing the GABAB2 subunit bearing the double mutation of K572 and D688. A. The cell surface expression of the receptors was analyzed using an ELISA method on intact cells as described in figure 3. The data are the means ± sem of at least three independent experiments performed in triplicates. B. Functional responses of mutated receptors. The ligand-induced activity of the mutated receptors was measured as described in figure 3. The data are the means ± sem of at least three independent experiments performed in triplicates.
Fig. 6
Fig. 6
Expression at the cell surface and functional assay of the receptors containing the GABAB2 subunit bearing the double mutation of R575 and D688. A. The cell surface expression of the receptors was analyzed using an ELISA method on intact cells as described in figure 3. The data are the means ± sem of at least three independent experiments performed in triplicates. B. Functional responses of mutated receptors. The ligand-induced activity of the mutated receptors was measured as described in figure 3. The data are the means ± sem of at least three independent experiments performed in triplicates.
Fig. 7
Fig. 7
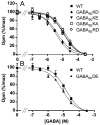
A. Dose-response curves of the receptor in a functional InP assay. The mutated receptor activity was measured in the presence of increasing concentrations of GABA. The indicated GABAB2 subunits were expressed together with the wild-type GABAB1 subunit and the Gqi9 chimeric G protein. See Material and Methods for details. This experiment is representative of three independent experiments performed in triplicates.
Fig. 8
Fig. 8
Displacement curves of the radioligand [3H]CGP54626 by increasing concentrations of GABA, on wild-type and mutated GABAB receptor. The indicated GABAB2 subunits were expressed together with the wild-type GABAB1 subunit. See Material and Methods for details. A. Displacement curves on the wild-type GABAB receptor and on receptors bearing the mutations K572D, E or A and R575D. This experiments is representative of three independent experiments performed in triplicates. B. Displacement curves on the wild-type GABAB receptor and on receptors bearing the mutation D688E. This experiment is representative of three independent experiments performed in triplicates.
Fig. 9
Fig. 9
Putative functional role of the residues K572, R575, and D688 at the interface of the TM3 and TM6 of GABAB2. A. Three-dimensional model of the mutated GABAB2. For clarity, only the region of the mutated residues (K572, R575, and D688) is shown. The structure rendering and the color code used are as in Fig 2. B. Schematic representation of the putative effect of the mutation K572D and of the reversing effect of the double mutation K572D-D688K in GABAB2 deduced from the experimental data and the structural analysis.

Similar articles

Cited by

References

    1. Bockaert J, Claeysen S, Becamel C, Pinloche S, Dumuis A. Int Rev Cytol. 2002;212:63–132. - PubMed
    1. Karnik SS, Gogonea C, Patil S, Saad Y, Takezako T. Trends Endocrinol Metab. 2003;14:431–437. - PubMed
    1. Gether U. Endocr Rev. 2000;21:90–113. - PubMed
    1. Palczewski K, Kumasaka T, Hori T, Behnke CA, Motoshima H, Fox BA, Le Trong I, Teller DC, Okada T, Stenkamp RE, Yamamoto M, Miyano M. Science. 2000;289:739–745. - PubMed
    1. Fredriksson R, Lagerstrom MC, Lundin LG, Schioth HB. Mol Pharmacol. 2003;63:1256–1272. - PubMed

Publication types