Revisiting the basic reproductive number for malaria and its implications for malaria control
- PMID: 17311470
- PMCID: PMC1802755
- DOI: 10.1371/journal.pbio.0050042
Revisiting the basic reproductive number for malaria and its implications for malaria control
Abstract
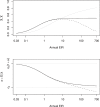
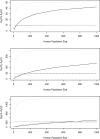
The prospects for the success of malaria control depend, in part, on the basic reproductive number for malaria, R0. Here, we estimate R0 in a novel way for 121 African populations, and thereby increase the number of R0 estimates for malaria by an order of magnitude. The estimates range from around one to more than 3,000. We also consider malaria transmission and control in finite human populations, of size H. We show that classic formulas approximate the expected number of mosquitoes that could trace infection back to one mosquito after one parasite generation, Z0(H), but they overestimate the expected number of infected humans per infected human, R0(H). Heterogeneous biting increases R0 and, as we show, Z0(H), but we also show that it sometimes reduces R0(H); those who are bitten most both infect many vectors and absorb infectious bites. The large range of R0 estimates strongly supports the long-held notion that malaria control presents variable challenges across its transmission spectrum. In populations where R0 is highest, malaria control will require multiple, integrated methods that target those who are bitten most. Therefore, strategic planning for malaria control should consider R0, the spatial scale of transmission, human population density, and heterogeneous biting.
Conflict of interest statement
Figures


Similar articles
-
Persistent oscillations and backward bifurcation in a malaria model with varying human and mosquito populations: implications for control.J Math Biol. 2015 Jun;70(7):1581-622. doi: 10.1007/s00285-014-0804-9. Epub 2014 Jul 4. J Math Biol. 2015. PMID: 24992885
-
Spatial panorama of malaria prevalence in Africa under climate change and interventions scenarios.Int J Health Geogr. 2018 Jan 16;17(1):2. doi: 10.1186/s12942-018-0122-3. Int J Health Geogr. 2018. PMID: 29338736 Free PMC article.
-
Statics and dynamics of malaria infection in Anopheles mosquitoes.Malar J. 2004 Jun 4;3:13. doi: 10.1186/1475-2875-3-13. Malar J. 2004. PMID: 15180900 Free PMC article. Review.
-
[Current malaria situation in the Republic of Kazakhstan].Med Parazitol (Mosk). 2001 Jan-Mar;(1):24-33. Med Parazitol (Mosk). 2001. PMID: 11548308 Russian.
-
Determinants of Malaria Transmission at the Population Level.Cold Spring Harb Perspect Med. 2017 Dec 1;7(12):a025510. doi: 10.1101/cshperspect.a025510. Cold Spring Harb Perspect Med. 2017. PMID: 28242786 Free PMC article. Review.
Cited by
-
A regional-scale, high resolution dynamical malaria model that accounts for population density, climate and surface hydrology.Malar J. 2013 Feb 18;12:65. doi: 10.1186/1475-2875-12-65. Malar J. 2013. PMID: 23419192 Free PMC article.
-
Mapping intra-urban malaria risk using high resolution satellite imagery: a case study of Dar es Salaam.Int J Health Geogr. 2016 Jul 30;15(1):26. doi: 10.1186/s12942-016-0051-y. Int J Health Geogr. 2016. PMID: 27473186 Free PMC article.
-
Uncertainty in mapping malaria epidemiology: implications for control.Epidemiol Rev. 2010;32(1):175-87. doi: 10.1093/epirev/mxq013. Epub 2010 Jun 25. Epidemiol Rev. 2010. PMID: 20581219 Free PMC article.
-
Impact of insecticide resistance on malaria vector competence: a literature review.Malar J. 2023 Jan 17;22(1):19. doi: 10.1186/s12936-023-04444-2. Malar J. 2023. PMID: 36650503 Free PMC article. Review.
-
The risks of malaria infection in Kenya in 2009.BMC Infect Dis. 2009 Nov 20;9:180. doi: 10.1186/1471-2334-9-180. BMC Infect Dis. 2009. PMID: 19930552 Free PMC article.
References
-
- Snow RW, Omumbo JA. Malaria. In: Jamison DT, Feachem RG, Makgoba MW, Bos ER, Baingana FK, et al., editors. Disease and mortality in sub-Saharan Africa, 2nd edition. Washington (D. C.): World Bank; 2006. pp. 195–231.
-
- Snow RW, Omumbo JA, Lowe B, Molyneux CS, Obiero JO, et al. Relation between severe malaria morbidity in children and level of Plasmodium falciparum transmission in Africa. Lancet. 1997;349:1650–1654. - PubMed
-
- Marsh K, Snow RW. Malaria transmission and morbidity. Parassitologia. 1999;41:241–246. - PubMed
Publication types
MeSH terms
Grants and funding
LinkOut - more resources
Full Text Sources
Other Literature Sources
Medical

