. 2007 Feb;33(1):183-200.
doi: 10.1037/0096-1523.33.1.183.

Variability in stepping direction explains the veering behavior of blind walkers

Affiliations

Variability in stepping direction explains the veering behavior of blind walkers

Christopher S Kallie et al. J Exp Psychol Hum Percept Perform. 2007 Feb.

Abstract

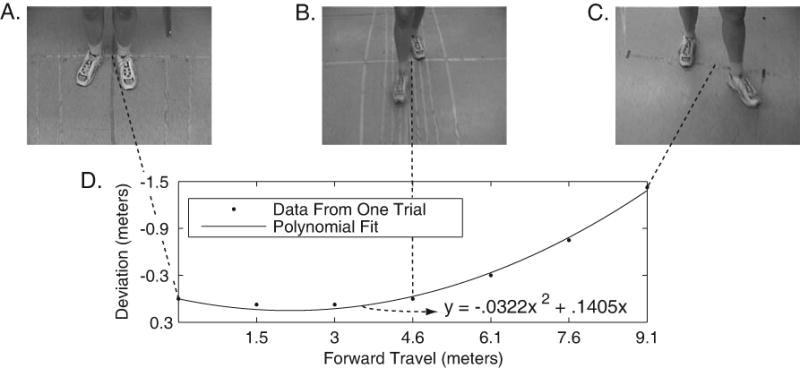
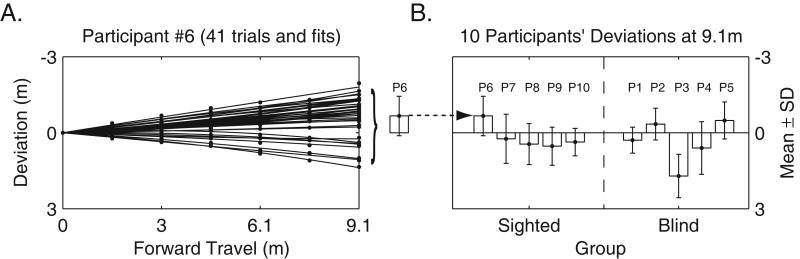
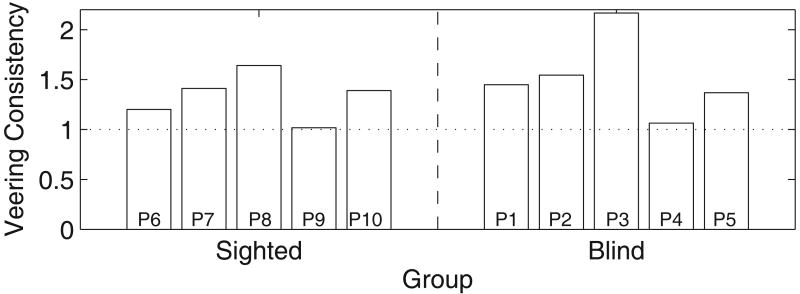
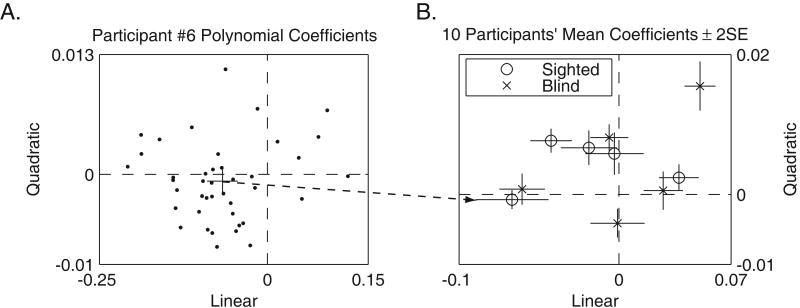
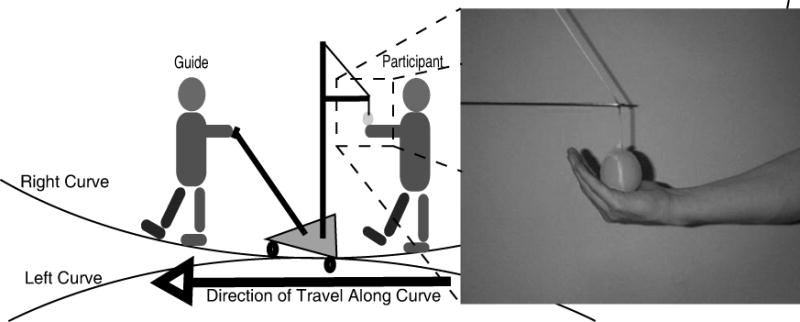
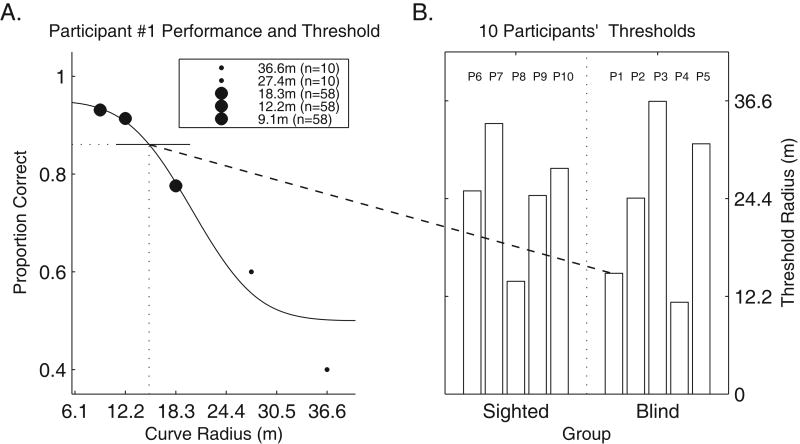
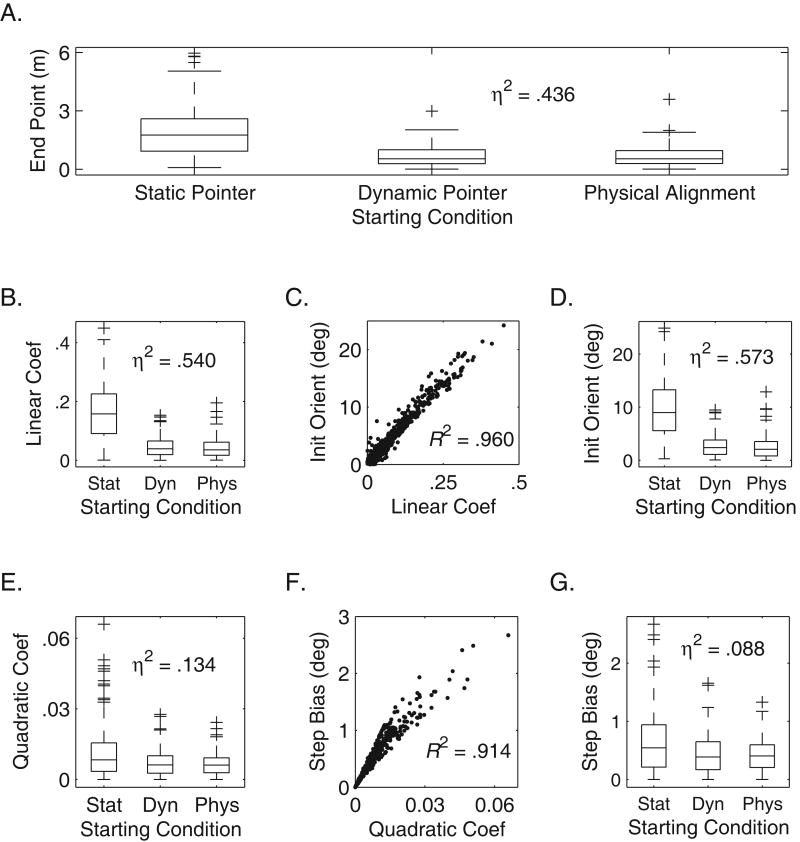
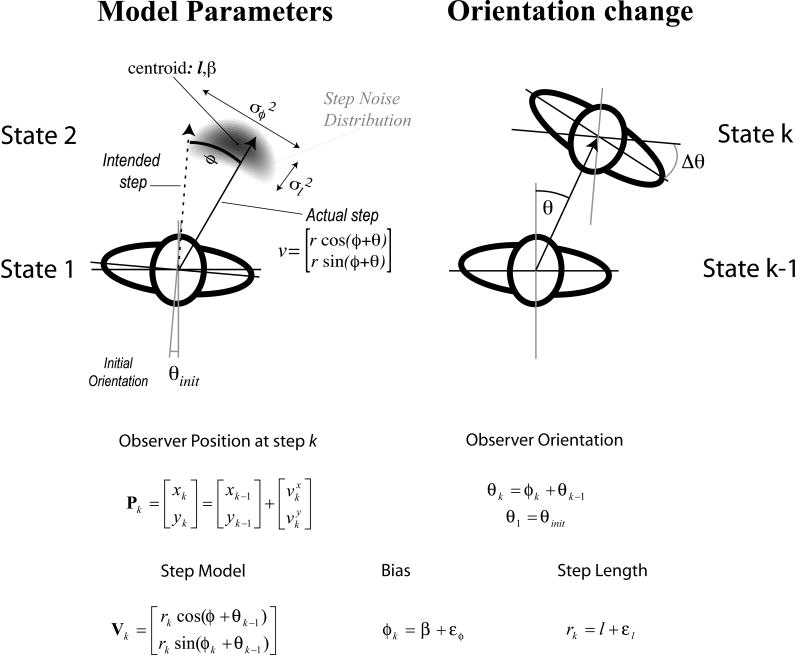
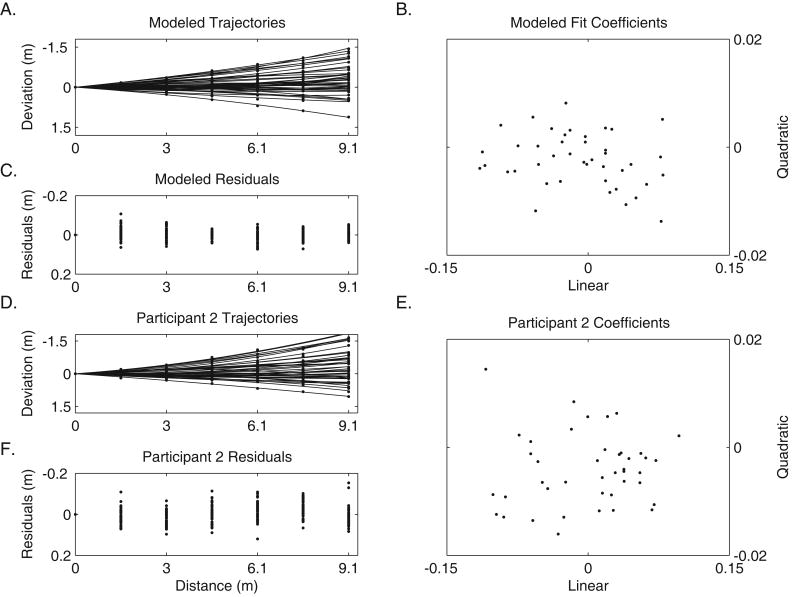
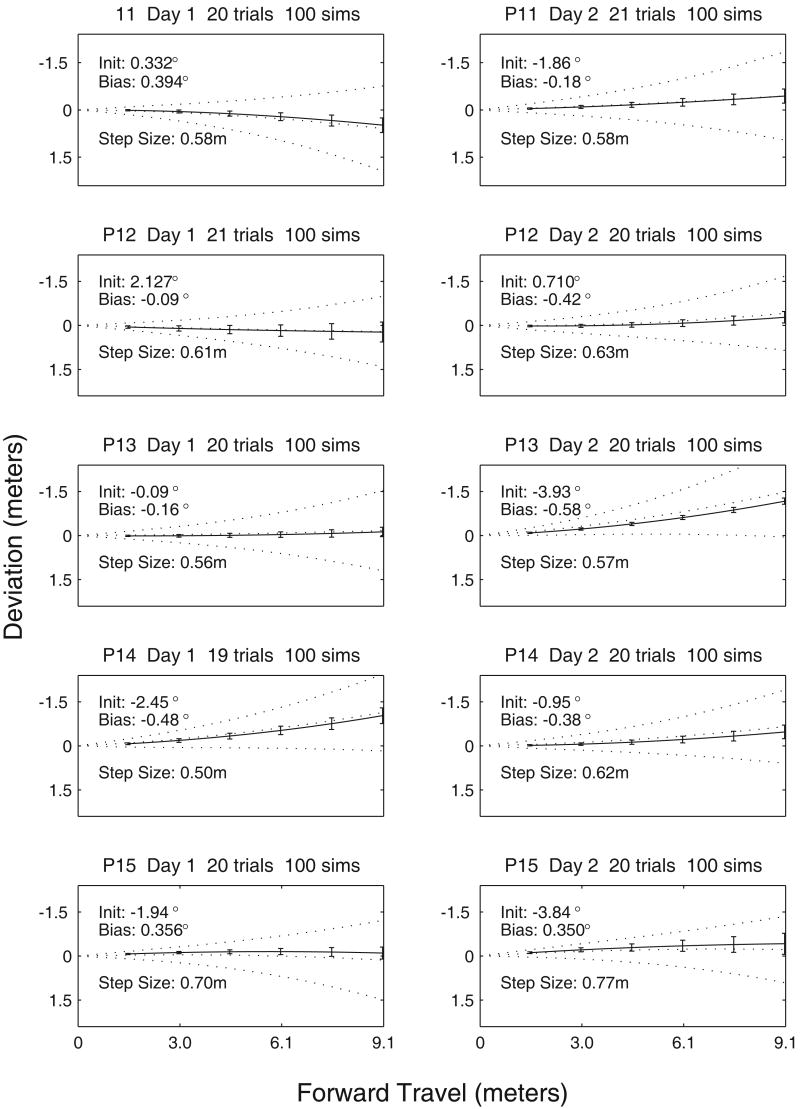
Walking without vision results in veering, an inability to maintain a straight path that has important consequences for blind pedestrians. In this study, the authors addressed whether the source of veering in the absence of visual and auditory feedback is better attributed to errors in perceptual encoding or undetected motor error. Three experiments had the following results: No significant differences in the shapes of veering trajectories were found between blind and blindfolded participants; accuracy in detecting curved walking paths was not correlated with simple measures of veering behavior; and explicit perceptual cues to initial walking direction did not reduce veering. The authors present a model that accounts for the major characteristics of participants' veering behavior by postulating 3 independent sources of undetected motor error: initial orientation, consistent biases in step direction, and, most important, variable error in individual steps.


Figures

Figure 1
Figure 1
Example of One Trial and Polynomial Fit. A unique second-order polynomial was fitted for each trial.
Figure 2
Figure 2
Walking Performance without Vision. Figure 2A shows sighted participant P6's performance on 41 trials. The fan shape created over many trials is typical of this and earlier studies of veering associated with walking without vision. Figure 2B shows the average deviation for each participant, 9.14 meters from the origin (See Table 2 for values). In this study, leftward veering is associated with a negative sign, and rightward veering is positive.
Figure 3
Figure 3
Veering Consistency Across Days. Figure 3 shows the ratio of signed endpoint variance δtotal2 across days to the average of the within day variances δi2.
Figure 4
Figure 4
Quadratic and Linear Contributions to Walking Trials. Figure 4A shows the distribution of linear and quadratic coefficients over 41 trials for participant P6. Each data point represents a polynomial fit for a single trajectory. The crosshair in the middle of Figure 4A shows the mean ± 2 standard errors. Figure 4B shows the mean polynomial coefficients for all 10 participants.
Figure 5
Figure 5
Curvature Detection Guiding Apparatus.
Figure 6
Figure 6
Curvature Detection Performance and Threshold Calculations. Figure 6A shows curve detection performance of one participant. Figure 6B shows 90% correct threshold radii for all participants.
Figure 7
Figure 7
Effects of 3 Starting Conditions on 5 Measures of Veering Trajectories. These graphs show effects of starting condition on measures of veering. All data were analyzed in absolute values. Figure 7A shows box plots of the distributions of end point offsets at 9.14 meters (repeated measures ANOVA effect size of starting condition: η2 = .436). Figure 7B and 7E show the effect of starting condition on linear and quadratic coefficients of the trajectories. Figure 7D and 7G show the effect of starting condition on initial orientation and step direction bias. Figure 7C and 7F show the linear relationships between these measures and the polynomial coefficients. See Table 4 for statistics.
Figure 8
Figure 8
Stepping Model for Walking. The walker's state is specified by her global 2D position pk and orientation θk. Each step of average length l is in the direction of the walker's current orientation, but the executed step vk differs by the addition of noise in both the length (mean = l, variance = σl2) and direction of the step (mean = β, variance = σφ2). By the end of each step, the walker's orientation has changed to point in the direction of the executed step. Initial orientation is a random variable across walks.
Figure 9
Figure 9
Human and Model Comparison. Figure 9A shows modeled data with fitted curves, resulting polynomial coefficients (Figure 9B), and their corresponding residuals (Figure 9C) – for modeled trajectories based on parameters from an “average” walker (see marginal means in Table 6). Empirical data from Participant 2 are shown in 9D, 9E and 9F.
Figure 10
Figure 10
Real and Simulated Trajectories. Each panel shows a summary for trials based on the estimated parameters from Experiment 3. Solid curves show the means (± 1 SE) of Experiment 3 trajectories. Simulated trajectories are shown with 3 dotted curves, representing the mean (± 1 SD).

References

    1. Bauby CE, Kuo AD. Active control of lateral balance in human walking. Journal of Biomechanics. 2000;33:1433–1440. - PubMed
    1. Chance SS, Gaunet F, Beall AC, Loomis JM. Locomotion mode affects the updating of objects encountered during travel: The contribution of vestibular and proprioceptive inputs to path integration. Presence-Teleoperators and Virtual Environments. 1998;7:168–178.
    1. Cicinelli JG. Master's Thesis. Department of Psychology, University of California; Santa Barbara: 1989. Veer as a function of preview and walking speed.
    1. Cohen HS. Vestibular disorders and impaired path integration along a linear trajectory. Journal of Vestibular Research. 2000;10:7–15. - PubMed
    1. Cratty BJ. Perceptual thresholds of non-visual locomotion (Part 1) Los Angeles: University of California; 1965.

Publication types