Transgenerational changes in the genome stability and methylation in pathogen-infected plants: (virus-induced plant genome instability)
- PMID: 17311811
- PMCID: PMC1865051
- DOI: 10.1093/nar/gkm029
Transgenerational changes in the genome stability and methylation in pathogen-infected plants: (virus-induced plant genome instability)
Abstract
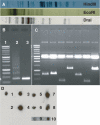
Previously, we reported the generation of a virus-induced systemic signal that increased the somatic and meiotic recombination rates in tobacco mosaic virus (TMV)-infected tobacco plants. Here, we analyzed the progeny of plants that received the signal and found that these plants also have a higher frequency of rearrangements in the loci carrying the homology to LRR region of the gene of resistance to TMV (N-gene). Analysis of the stability of repetitive elements from Nicotiana tabacum loci and 5.8S ribosomal RNA loci did not show any changes. Further analysis of the changes in the progeny of infected plants revealed that they had substantially hypermethylated genomes. At the same time, loci-specific methylation analysis showed: (1) profound hypomethylation in several LRR-containing loci; (2) substantial hypermethylation of actin loci and (3) no change in methylation in the loci of repetitive elements from N. tabacum or 5.8S ribosomal RNA. Global genome hypermethylation of the progeny is believed to be part of a general protection mechanism against stress, whereas locus-specific hypomethylation is associated with a higher frequency of rearrangements. Increased recombination events combined with the specific methylation pattern induced by pathogen attack could be a sign of an adaptive response by plants.
Figures


Similar articles
-
Tobacco mosaic virus infection results in an increase in recombination frequency and resistance to viral, bacterial, and fungal pathogens in the progeny of infected tobacco plants.Plant Physiol. 2010 Aug;153(4):1859-70. doi: 10.1104/pp.110.157263. Epub 2010 May 24. Plant Physiol. 2010. PMID: 20498336 Free PMC article.
-
Pathogen-induced systemic plant signal triggers DNA rearrangements.Nature. 2003 Jun 12;423(6941):760-2. doi: 10.1038/nature01683. Nature. 2003. PMID: 12802336
-
Genetic and epigenetic effects of plant-pathogen interactions: an evolutionary perspective.Mol Plant. 2011 Nov;4(6):1014-23. doi: 10.1093/mp/ssr022. Epub 2011 Mar 31. Mol Plant. 2011. PMID: 21459830 Review.
-
Local infection with oilseed rape mosaic virus promotes genetic rearrangements in systemic Arabidopsis tissue.Mutat Res. 2011 May 10;709-710:7-14. doi: 10.1016/j.mrfmmm.2011.02.014. Epub 2011 Mar 3. Mutat Res. 2011. PMID: 21376739
-
Pathogen-induced systemic DNA rearrangement in plants.Trends Plant Sci. 2004 Feb;9(2):60-1. doi: 10.1016/j.tplants.2003.12.002. Trends Plant Sci. 2004. PMID: 15106587 Review.
Cited by
-
Differential expression of microRNAs in response to Papaya ringspot virus infection in differentially responding genotypes of papaya (Carica papaya L.) and its wild relative.Front Plant Sci. 2024 Jun 20;15:1398437. doi: 10.3389/fpls.2024.1398437. eCollection 2024. Front Plant Sci. 2024. PMID: 38966149 Free PMC article.
-
Analyses of Methylomes Derived from Meso-American Common Bean (Phaseolus vulgaris L.) Using MeDIP-Seq and Whole Genome Sodium Bisulfite-Sequencing.Front Plant Sci. 2016 Apr 26;7:447. doi: 10.3389/fpls.2016.00447. eCollection 2016. Front Plant Sci. 2016. PMID: 27199997 Free PMC article.
-
Characterization of maize miRNAs responsive to maize Iranian mosaic virus infection.3 Biotech. 2022 Mar;12(3):69. doi: 10.1007/s13205-022-03134-1. Epub 2022 Feb 12. 3 Biotech. 2022. PMID: 35223355 Free PMC article.
-
High-resolution DNA methylome reveals that demethylation enhances adaptability to continuous cropping comprehensive stress in soybean.BMC Plant Biol. 2019 Feb 18;19(1):79. doi: 10.1186/s12870-019-1670-9. BMC Plant Biol. 2019. PMID: 30777019 Free PMC article.
-
Comparative assessment of genetic and epigenetic variation among regenerants of potato (Solanum tuberosum) derived from long-term nodal tissue-culture and cell selection.Plant Cell Rep. 2011 Apr;30(4):631-9. doi: 10.1007/s00299-010-0983-9. Epub 2011 Jan 6. Plant Cell Rep. 2011. PMID: 21210276
References
-
- Shinozaki K, Yamaguchi-Shinozaki K, Seki M. Regulatory network of gene expression in the drought and cold stress responses. Curr. Opin. Plant Biol. 2003;6:410–417. - PubMed
-
- Sung DY, Kaplan F, Lee KJ, Guy CL. Acquired tolerance to temperature extremes. Trends Plant Sci. 2003;8:179–187. - PubMed
-
- Chinnusamy V, Schumaker K, Zhu JK. Molecular genetic perspectives on cross-talk and specificity in abiotic stress signalling in plants. J. Exp. Bot. 2004;55:225–236. - PubMed

