. 2007 Mar 19;204(3):547-57.
doi: 10.1084/jem.20062381. Epub 2007 Feb 20.

Interleukin-2 enhances CD4+ T cell memory by promoting the generation of IL-7R alpha-expressing cells

Affiliations

Interleukin-2 enhances CD4+ T cell memory by promoting the generation of IL-7R alpha-expressing cells

Hans Dooms et al. J Exp Med. .

Abstract

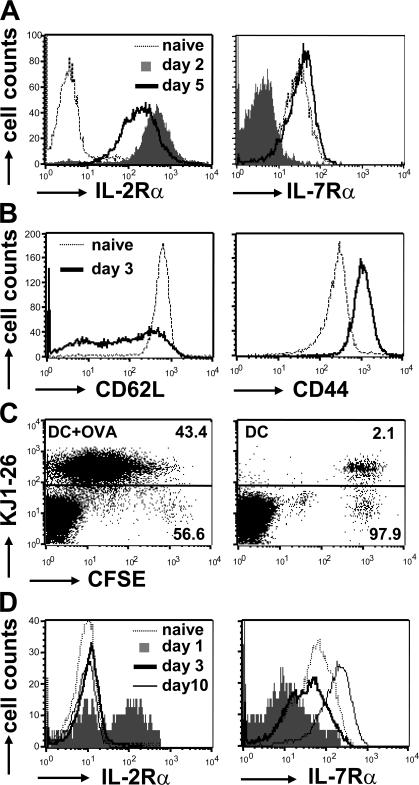
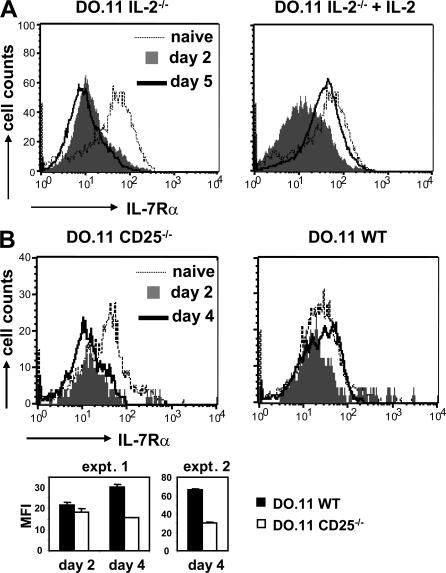
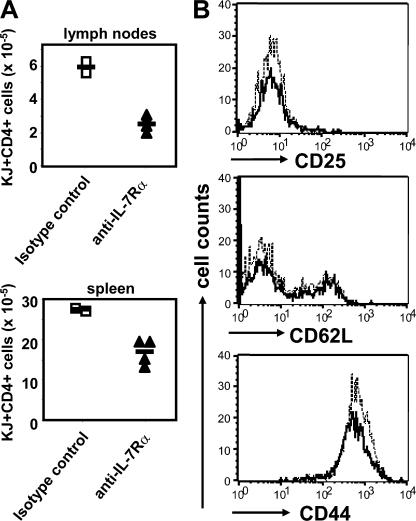
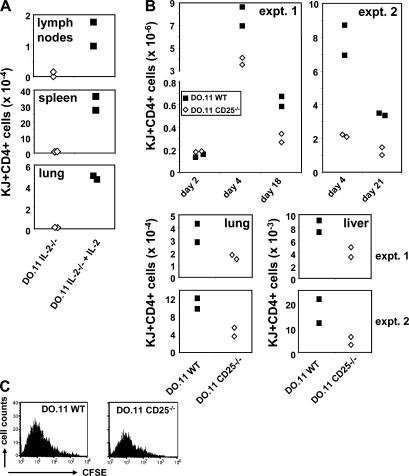
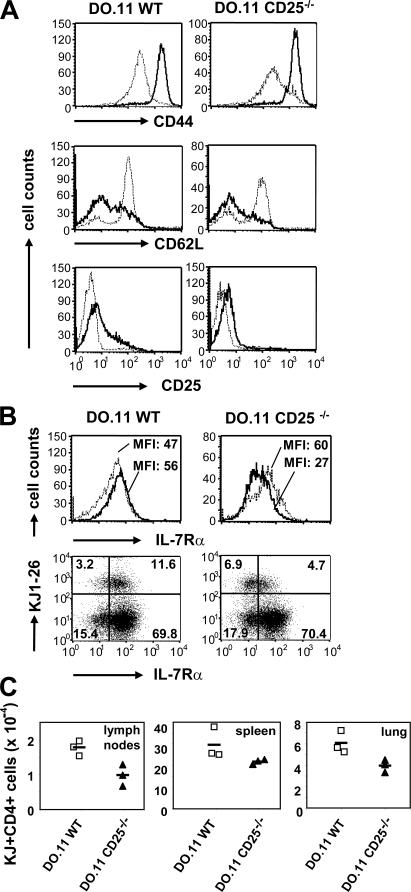
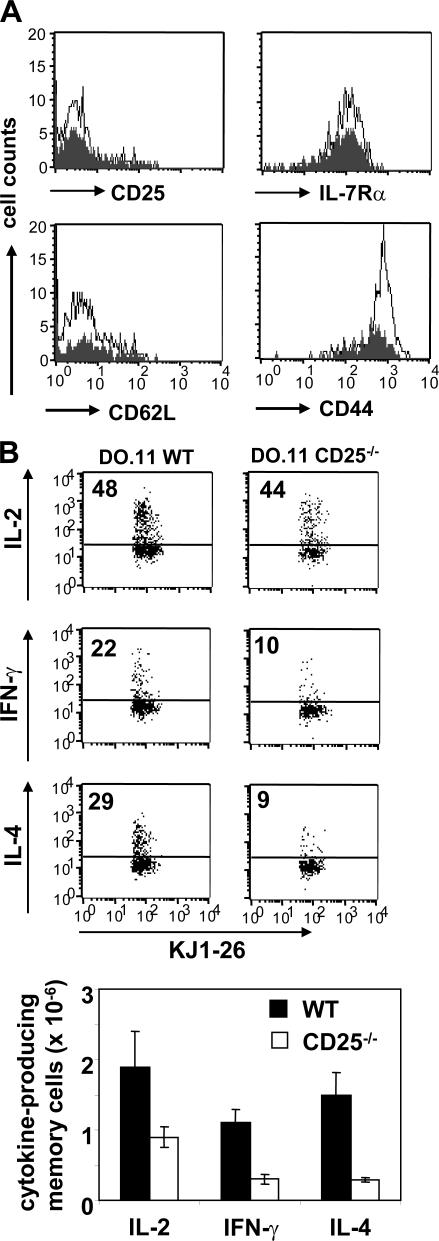
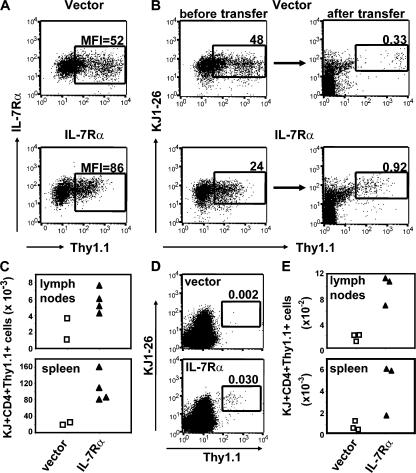
The common gamma chain cytokines interleukin (IL)-2 and IL-7 are important regulators of T cell homeostasis. Although IL-2 is implicated in the acute phase of the T cell response, IL-7 is important for memory T cell survival. We asked whether regulated responsiveness to these growth factors is determined by temporal expression of the cytokine-specific IL-2 receptor (R) alpha and IL-7Ralpha chains. We demonstrate that IL-2Ralpha is expressed early after priming in T cell receptor-transgenic CD4(+) T cells, whereas IL-7Ralpha expression is lost. In the later stage of the response, IL-7Ralpha is reexpressed while IL-2Ralpha expression is silenced. This reciprocal pattern of IL-2Ralpha/IL-7Ralpha expression is disturbed when CD4(+) T cells are primed in the absence of IL-2 signals. Primed IL-2(-/-) or CD25(-/-) (IL-2Ralpha(-/-)) CD4(+) T cells, despite showing normal induction of activation markers and cell division, fail to reexpress IL-7Ralpha late in the response. Because the generation of CD4(+) memory T cells is dependent on IL-7-IL-7Ralpha interactions, primed IL-2(-/-) or CD25(-/-) CD4(+) T cells develop poorly into long-lived memory cells. Retrovirus-mediated expression of IL-7Ralpha in IL-2(-/-) T cells restores their capacity for long-term survival. These results identify IL-2 as a factor regulating IL-7Ralpha expression and, consequently, memory T cell homeostasis in vivo.


Figures

Figure 1.
Figure 1.
Reciprocal regulation of IL-2Rα and IL-7Rα after T cell activation. (A) 2.5 × 10⁵ CD4+ T cells from DO.11 mice were primed in vitro with 1 μg/ml OVA peptide and 2.5 × 10⁶ APCs. Naive T cells and cells harvested from the cultures on days 2 and 5 of priming were stained with KJ1-26, anti-CD4, and antibodies against IL-2Rα and IL-7Rα. Receptor expression levels were analyzed by flow cytometry. Data are representative of two independent experiments. (B) 5 × 10⁶ naive DO.11 T cells were adoptively transferred into BALB/c mice and primed in vivo 24 h later with 3 × 10⁶ OVA-pulsed DCs. Histograms show expression of CD62L and CD44 on naive and primed (day 3) KJ1-26+CD4+ T cells in the spleen. (C) CFSE-labeled DO.11 T cells were primed as in B (left) or with control DCs (no OVA; right). On day 3 after priming, spleen cell suspensions were stained with KJ1-26 and anti-CD4. Dot plots show CFSE dilution versus KJ1-26 staining gated on the CD4+ T cell population. Numbers indicate percentages of KJ1-26+ and KJ1-26 T cells within the total CD4+ T cell population. (D) Spleens of the primed mice from B were harvested on the indicated days, and IL-2Rα and IL-7Rα expression on KJ1-26+CD4+ T cells was determined as in A. Data are representative of three separate experiments.
Figure 2.
Figure 2.
IL-2 regulates IL-7Rα reexpression on activated T cells. (A) 2.5 ×10⁵ IL-2−/− DO.11 T cells were primed in vitro with 1 μg/ml OVA peptide and 2.5 × 10⁶ IL-2−/− APCs in the absence or presence of 10 ng/ml of added recombinant IL-2. IL-2Rα and IL-7Rα expression was examined as described in Fig. 1 A. Results are from one representative experiment out of three. (B) 2 × 10⁶ WT and CD25−/− DO.11 T cells were adoptively transferred into BALB/c recipients and primed in vivo with 106 OVA-pulsed DCs. Histograms show IL-7Rα expression on KJ-26+CD4+ cells in the spleen. (bottom) Average mean fluorescence intensity (MFI) ± SD of IL-7Rα staining on WT and CD25−/− DO.11 T cells from the spleen (two mice per group). Primed WT and CD25−/− DO.11 T cells showed no difference in IL-7Rα expression on day 2 (P = 0.095), but significantly different IL-7Rα levels were measured on day 4 in both expt. 1 (P = 0.007) and expt. 2 (P = 0.0005).
Figure 3.
Figure 3.
IL-7–IL-7Rα is required for CD4 memory cell survival. WT DO.11 T cells were primed in vitro as in Fig. 1 A. Primed cells were harvested on day 4, and 30 × 106 cells were adoptively transferred into BALB/c recipients. From day 2 after transfer, 1 mg anti–IL-7Rα or isotype control antibody was injected IP every other day for 10 d. Spleen and lymph nodes of the treated mice were harvested on day 12, and DO.11 T cells were stained with KJ1-26 and anti-CD4 mAbs. (A) Absolute numbers of DO.11 T cells present in lymph nodes and spleen. Each symbol represents an individual mouse. Cell numbers with and without anti–IL-7Rα treatment were significantly different in both lymph nodes (P = 0.001) and spleen (P = 0.009). Horizontal lines represent mean cell numbers. (B) Expression of CD25, CD62L, and CD44 on DO.11 T cells from the spleen of one representative mouse treated with anti-IL-7Rα (bold line) or isotype control (continuous line).
Figure 4.
Figure 4.
IL-2 during priming enhances T cell survival in vivo in lymphoid and nonlymphoid tissues. (A) IL-2−/− DO.11 T cells were primed in vitro with or without IL-2, as described in Fig. 2 A, and 10 × 106 primed cells were adoptively transferred to BALB/c recipients. 4 wk later, DO.11 T cell numbers in the lymph nodes, spleen (P = 0.02), and lung (P = 0.0009) of recipient mice were examined as in Fig. 3 A. Data points represent individual mice. (B) 2 × 10⁶ (expt. 1) or 7.5 × 10⁵ (expt. 2) CFSE-labeled naive WT and CD25−/− DO.11 T cells were primed in vivo with 106 (expt. 1) or 3 × 10⁶ (expt. 2) OVA-pulsed DCs, and numbers of KJ1-26+CD4+ cells in the spleen, lung, and liver were determined. The two top panels show WT and CD25−/− DO.11 T cell numbers recovered from the spleens on days 2, 4, and 18–21. Cell numbers did not differ between both groups on day 2 (P = 0.07), but were significantly different on day 4 (expt. 1, P = 0.046; expt. 2, P= 0.023), day 18 (P = 0.029), and day 21 (P = 0.009). Bottom panels show DO.11 T cell numbers present in the lung and liver on day 18 (expt. 1) and day 21 (expt. 2). (C) CFSE dilution of WT and CD25−/− DO.11 cells in the spleen on day 4 after priming. Data shown are from one representative experiment (two mice per group) out of three.
Figure 5.
Figure 5.
Failure to reexpress IL-7Rα in the absence of IL-2 correlates with reduced memory cell survival. 2 × 10⁶ naive WT and CD25−/− T cells were adoptively transferred to BALB/c mice and primed in vivo with 3 × 10⁶ OVA-pulsed DCs. Lymph nodes and spleen of recipient mice were harvested on day 3. (A) Naive (continuous line) and primed (bold line) KJ1-26+CD4+ T cells were stained for the activation markers CD44, CD62L, and CD25 and analyzed by flow cytometry. Histograms represent pooled cell samples from recipients of WT (n = 10) and CD25−/− (n = 20) T cells. Data are representative of three separate experiments. (B) Histograms compare IL-7Rα expression on naive (continuous line) with primed (bold line) WT and CD25−/− DO.11 T cells. MFI is indicated. Dot plots compare IL-7Rα expression on KJ1-26+ with KJ1-26 cells from the CD4+ T cell population. Numbers refer to percentages of IL-7Rαlow vs. IL-7Rαhigh cells within the CD4+ population. Histograms and dot plots represent pooled cell samples from recipients of WT (n = 10) and CD25−/− (n = 20) T cells. One representative experiment out of three is shown. (C) CD4+ T cells were purified from the lymph nodes and spleens 3 d after priming, and 10 × 106 primed WT and CD25−/− DO.11 T cells were adoptively transferred to secondary BALB/c recipients. DO.11 memory cell numbers in the lymph nodes (P = 0.02), spleen, and lung (P = 0.03) were analyzed as described for Fig. 4 B. Data points represent individual mice from one representative experiment out of two. Horizontal lines represent mean cell numbers.
Figure 6.
Figure 6.
Phenotypic and functional properties of memory cells generated in the absence of IL-2. 106 WT and CD25−/− DO.11 T cells were primed in vivo with 3 × 10⁶ OVA-pulsed DCs and analyzed 4 wk later. (A) Histograms show the phenotype of the WT (open) and CD25−/− (shaded) memory T cells recovered from the spleen. One representative mouse out of three is shown. (B) Some recipients were rechallenged with 3 × 10⁶ OVA-pulsed DCs, and 3 d later splenocytes were stained for cytokine production after brief in vitro restimulation. Dot plots show the frequency of IL-2–, IFN-γ–, and IL-4–producing cells within the CD4+ KJ1-26+ population. The bar graph shows total numbers of cytokine-producing DO.11 T cells. Error bars display SD (n = 3).
Figure 7.
Figure 7.
Retrovirus-mediated expression of IL-7Rα in IL-2−/− T cells restores memory cell generation. (A) IL-2−/− DO.11 T cells were retrovirally transduced with IL-7Rα or empty vector, and IL-7Rα and Thy1.1 expression were evaluated on day 4 by antibody staining and flow cytometry. MFI of IL-7Rα staining on the gated (Thy1.1+) population is indicated. (B) 3 × 10⁶ IL-2−/− DO.11 T cells, of which 48% (empty vector) and 24% (IL-7Rα) expressed the Thy1.1 reporter gene, were adoptively transferred to BALB/c recipients, and the presence of Thy1.1+ DO.11 T cells was analyzed 3 wk after transfer. (right) Dot plots show the percentage of KJ1-26+Thy1.1+ cells within the CD4+ population in the spleen of one representative recipient. (C) To normalize for the difference in the number of Thy1.1+ cells transferred between both groups, the number of KJ1-26+Thy1.1+ memory cells recovered from the lymph nodes and spleen per 106 KJ1-26+Thy1.1+ cells transferred was calculated. Data points represent individual mice. (D) IL-2−/− DO.11 T cells were retrovirally transduced as in A, and Thy1.1+KJ1-26+CD4+ cells were purified from the cultures on day 4 by cell sorting. 2 × 10⁶ Thy1.1+KJ1-26+CD4+ cells expressing either IL-7Rα or control vector were adoptively transferred into BALB/c recipients, and the presence of Thy1.1+ DO.11 T cells was analyzed 2 wk after transfer. Dot plots show the percentage of KJ1-26+Thy1.1+ cells within the CD4+ population in the spleen of one representative recipient. (E) Total number of KJ1-26+Thy1.1+CD4+ cells recovered from the lymph nodes and spleen per 2 × 10⁶ purified cells transferred. Data points represent individual mice.

Similar articles

Cited by

References

    1. Kaech, S.M., and R. Ahmed. 2001. Memory CD8+ T cell differentiation: initial antigen encounter triggers a developmental program in naive cells. Nat. Immunol. 2:415–422. - PMC - PubMed
    1. van Stipdonk, M.J., E.E. Lemmens, and S.P. Schoenberger. 2001. Naive CTLs require a single brief period of antigenic stimulation for clonal expansion and differentiation. Nat. Immunol. 2:423–429. - PubMed
    1. Lau, L.L., B.D. Jamieson, T. Somasundaram, and R. Ahmed. 1994. Cytotoxic T-cell memory without antigen. Nature. 369:648–652. - PubMed
    1. Murali-Krishna, K., L.L. Lau, S. Sambhara, F. Lemonnier, J. Altman, and R. Ahmed. 1999. Persistence of memory CD8 T cells in MHC class I-deficient mice. Science. 286:1377–1381. - PubMed
    1. Bourgeois, C., B. Rocha, and C. Tanchot. 2002. A role for CD40 expression on CD8+ T cells in the generation of CD8+ T cell memory. Science. 297:2060–2063. - PubMed

Publication types

MeSH terms

Substances