

Defects in lamin B1 expression or processing affect interphase chromosome position and gene expression
- PMID: 17312019
- PMCID: PMC2064018
- DOI: 10.1083/jcb.200607054
Defects in lamin B1 expression or processing affect interphase chromosome position and gene expression
Abstract
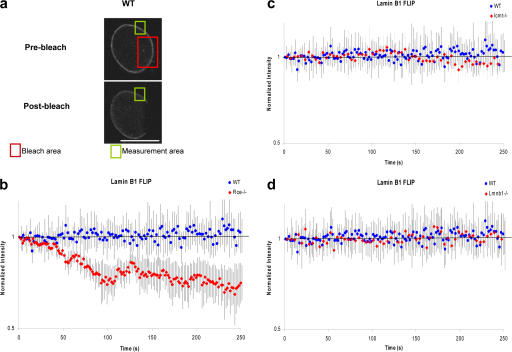
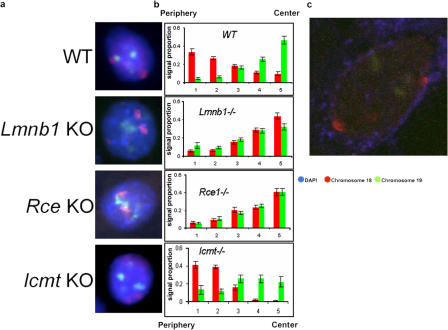
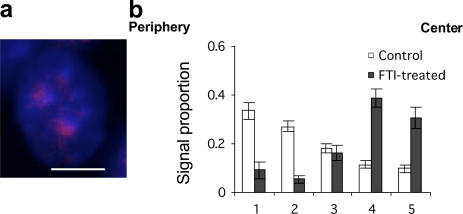
Radial organization of nuclei with peripheral gene-poor chromosomes and central gene-rich chromosomes is common and could depend on the nuclear boundary as a scaffold or position marker. To test this, we studied the role of the ubiquitous nuclear envelope (NE) component lamin B1 in NE stability, chromosome territory position, and gene expression. The stability of the lamin B1 lamina is dependent on lamin endoproteolysis (by Rce1) but not carboxymethylation (by Icmt), whereas lamin C lamina stability is not affected by the loss of full-length lamin B1 or its processing. Comparison of wild-type murine fibroblasts with fibroblasts lacking full-length lamin B1, or defective in CAAX processing, identified genes that depend on a stable processed lamin B1 lamina for normal expression. We also demonstrate that the position of mouse chromosome 18 but not 19 is dependent on such a stable nuclear lamina. The results implicate processed lamin B1 in the control of gene expression as well as chromosome position.
Figures


Similar articles
-
A carboxyl-terminal interaction of lamin B1 is dependent on the CAAX endoprotease Rce1 and carboxymethylation.J Cell Biol. 2003 Sep 29;162(7):1223-32. doi: 10.1083/jcb.200303113. Epub 2003 Sep 22. J Cell Biol. 2003. PMID: 14504265 Free PMC article.
-
The role of lamin B1 for the maintenance of nuclear structure and function.Nucleus. 2015;6(1):8-14. doi: 10.1080/19491034.2014.1003510. Nucleus. 2015. PMID: 25602590 Free PMC article. Review.
-
Nuclear pore protein TPR associates with lamin B1 and affects nuclear lamina organization and nuclear pore distribution.Cell Mol Life Sci. 2019 Jun;76(11):2199-2216. doi: 10.1007/s00018-019-03037-0. Epub 2019 Feb 14. Cell Mol Life Sci. 2019. PMID: 30762072 Free PMC article.
-
Nuclear envelope remodelling during human spermiogenesis involves somatic B-type lamins and a spermatid-specific B3 lamin isoform.Mol Hum Reprod. 2015 Mar;21(3):225-36. doi: 10.1093/molehr/gau111. Epub 2014 Dec 4. Mol Hum Reprod. 2015. PMID: 25477337
-
The nuclear envelopathies and human diseases.J Biomed Sci. 2009 Oct 22;16(1):96. doi: 10.1186/1423-0127-16-96. J Biomed Sci. 2009. PMID: 19849840 Free PMC article. Review.
Cited by
-
miR-23 regulation of lamin B1 is crucial for oligodendrocyte development and myelination.Dis Model Mech. 2009 Mar-Apr;2(3-4):178-88. doi: 10.1242/dmm.001065. Epub 2009 Feb 2. Dis Model Mech. 2009. PMID: 19259393 Free PMC article.
-
Spatial Genome Organization and Its Emerging Role as a Potential Diagnosis Tool.Front Genet. 2016 Jul 26;7:134. doi: 10.3389/fgene.2016.00134. eCollection 2016. Front Genet. 2016. PMID: 27507988 Free PMC article. Review.
-
Gene positioning.Cold Spring Harb Perspect Biol. 2010 Jun;2(6):a000588. doi: 10.1101/cshperspect.a000588. Epub 2010 May 19. Cold Spring Harb Perspect Biol. 2010. PMID: 20484389 Free PMC article. Review.
-
A large genomic deletion leads to enhancer adoption by the lamin B1 gene: a second path to autosomal dominant adult-onset demyelinating leukodystrophy (ADLD).Hum Mol Genet. 2015 Jun 1;24(11):3143-54. doi: 10.1093/hmg/ddv065. Epub 2015 Feb 20. Hum Mol Genet. 2015. PMID: 25701871 Free PMC article.
-
Lamin B1 mediates cell-autonomous neuropathology in a leukodystrophy mouse model.J Clin Invest. 2013 Jun;123(6):2719-29. doi: 10.1172/JCI66737. Epub 2013 May 15. J Clin Invest. 2013. PMID: 23676464 Free PMC article.
References
-
- Arkonac, B.M., L.C. Foster, N.E. Sibinga, C. Patterson, K. Lai, J.C. Tsai, M.E. Lee, M.A. Perrella, and E. Haber. 1998. Vascular endothelial growth factor induces heparin-binding epidermal growth factor-like growth factor in vascular endothelial cells. J. Biol. Chem. 273:4400–4405. - PubMed
-
- Bergo, M.O., G.K. Leung, P. Ambroziak, J.C. Otto, P.J. Casey, A.Q. Gomes, M.C. Seabra, and S.G. Young. 2001. Isoprenylcysteine carboxyl methyltransferase deficiency in mice. J. Biol. Chem. 276:5841–5845. - PubMed
-
- Bickmore, W.A., and A.D. Carothers. 1995. Factors affecting the timing and imprinting of replication on a mammalian chromosome. J. Cell Sci. 108:2801–2809. - PubMed
-
- Boyle, S., S. Gilchrist, J.M. Bridger, N.L. Mahy, J.A. Ellis, and W.A. Bickmore. 2001. The spatial organization of human chromosomes within the nuclei of normal and emerin-mutant cells. Hum. Mol. Genet. 10:211–219. - PubMed
Publication types
MeSH terms
Substances
LinkOut - more resources
Full Text Sources
Other Literature Sources
Molecular Biology Databases
Research Materials
