

Musculoskeletal adaptations in chronic spinal cord injury: effects of long-term soleus electrical stimulation training
- PMID: 17312092
- PMCID: PMC3270314
- DOI: 10.1177/1545968306293447
Musculoskeletal adaptations in chronic spinal cord injury: effects of long-term soleus electrical stimulation training
Abstract
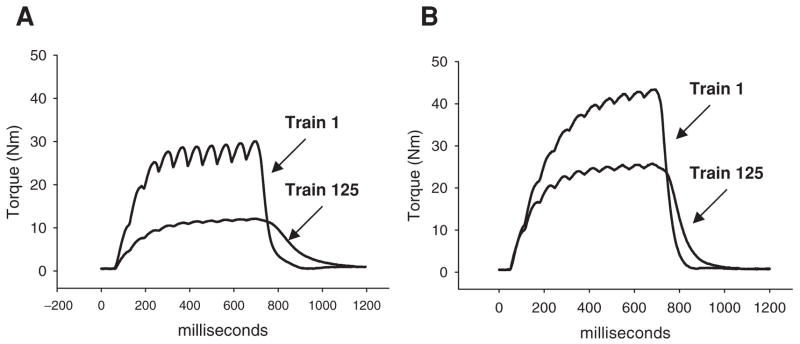
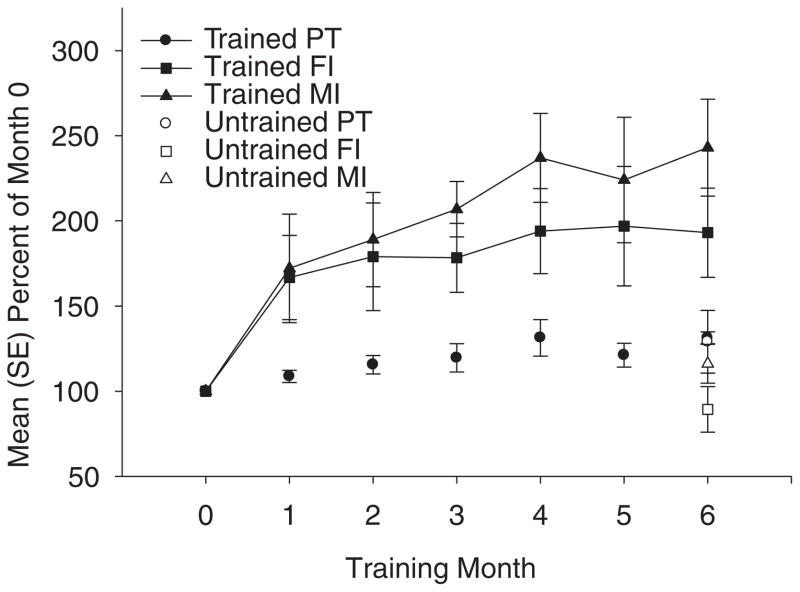
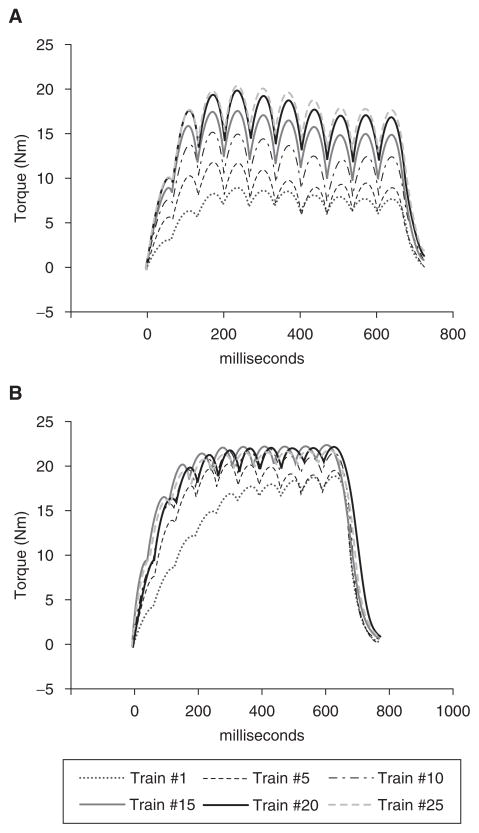
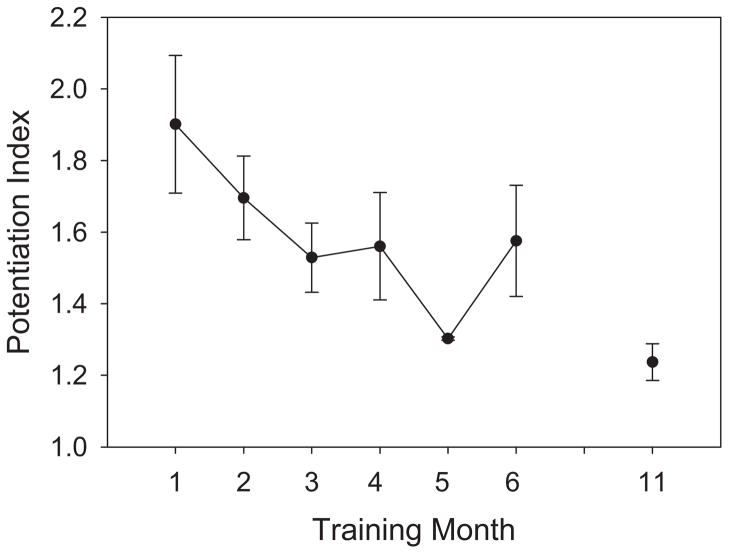
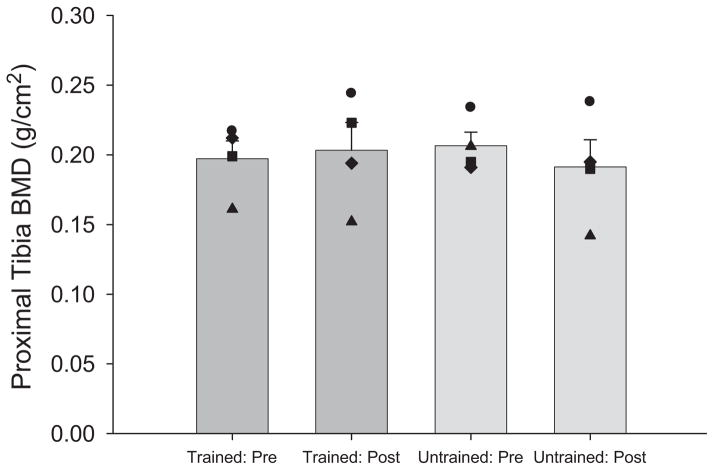
Objective: The purpose of this study was to determine whether long-term electrical stimulation training of the paralyzed soleus could change this muscle's physiological properties (torque, fatigue index, potentiation index, torque-time integral) and increase tibia bone mineral density.
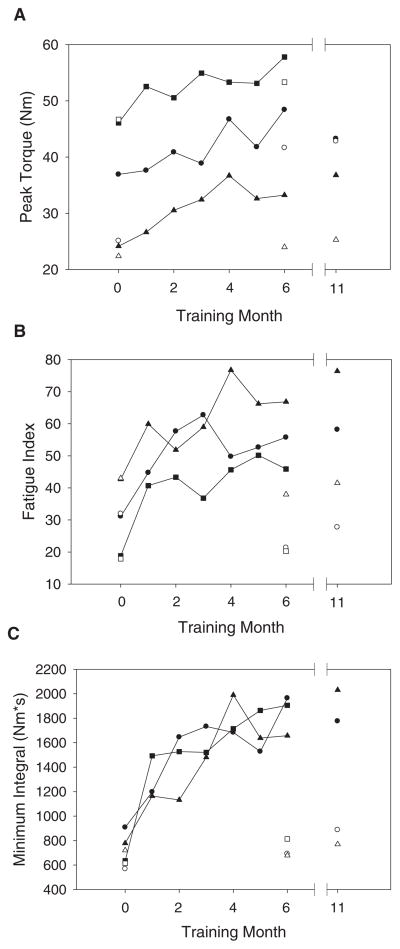
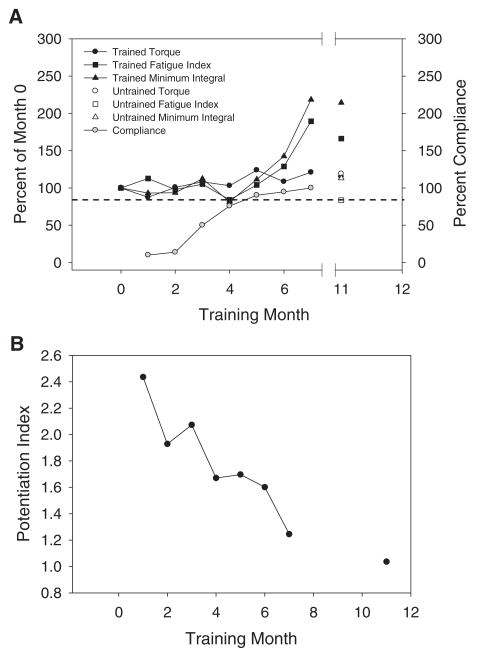
Methods: Four men with chronic (>2 years) complete spinal cord injury (SCI; American Spinal Injury Association classification A) trained 1 soleus muscle using an isometric plantar flexion electrical stimulation protocol. The untrained limb served as a within-subject control. The protocol involved ~ 30 minutes of training each day, 5 days a week, for a period of 6 to 11 months. Mean compliance over 11 months of training was 91% for 3 subjects. A fourth subject achieved high compliance after only 5 months of training. Mean estimated compressive loads delivered to the tibia were approximately 110% of body weight. Over the 11 months of training, the muscle plantar flexion torque, fatigue index, potentiation index, and torque-time integral were evaluated periodically. Bone mineral density (dual-energy x-ray absorptiometry) was evaluated before and after the training program.
Results: The trained limb fatigue index, potentiation index, and torque-time integral showed rapid and robust training effects (P<.05). Soleus electrical stimulation training yielded no changes to the proximal tibia bone mineral density, as measured by dual-energy x-ray absorptiometry. The subject with low compliance experienced fatigue index and torque-time integral improvements only when his compliance surpassed 80%. In contrast, his potentiation index showed adaptations even when compliance was low.
Conclusions: These findings highlight the persistent adaptive capabilities of chronically paralyzed muscle but suggest that preventing musculoskeletal adaptations after SCI may be more effective than reversing changes in the chronic condition.
Figures
Similar articles
-
Musculoskeletal plasticity after acute spinal cord injury: effects of long-term neuromuscular electrical stimulation training.J Neurophysiol. 2006 Apr;95(4):2380-90. doi: 10.1152/jn.01181.2005. Epub 2006 Jan 11. J Neurophysiol. 2006. PMID: 16407424 Free PMC article. Clinical Trial.
-
Postfatigue potentiation of the paralyzed soleus muscle: evidence for adaptation with long-term electrical stimulation training.J Appl Physiol (1985). 2006 Aug;101(2):556-65. doi: 10.1152/japplphysiol.00099.2006. Epub 2006 Mar 30. J Appl Physiol (1985). 2006. PMID: 16575026 Free PMC article. Clinical Trial.
-
Dose estimation and surveillance of mechanical loading interventions for bone loss after spinal cord injury.Phys Ther. 2008 Mar;88(3):387-96. doi: 10.2522/ptj.20070224. Epub 2008 Jan 17. Phys Ther. 2008. PMID: 18202080 Free PMC article.
-
Muscle and bone plasticity after spinal cord injury: review of adaptations to disuse and to electrical muscle stimulation.J Rehabil Res Dev. 2008;45(2):283-96. doi: 10.1682/jrrd.2007.02.0031. J Rehabil Res Dev. 2008. PMID: 18566946 Free PMC article. Review.
-
Muscular, skeletal, and neural adaptations following spinal cord injury.J Orthop Sports Phys Ther. 2002 Feb;32(2):65-74. doi: 10.2519/jospt.2002.32.2.65. J Orthop Sports Phys Ther. 2002. PMID: 11838582 Free PMC article. Review.
Cited by
-
The effects of aging and electrical stimulation exercise on bone after spinal cord injury.Aging Dis. 2013 Feb 7;4(3):141-53. Print 2013 Jun. Aging Dis. 2013. PMID: 23730530 Free PMC article.
-
Fatigue and non-fatigue mathematical muscle models during functional electrical stimulation of paralyzed muscle.Biomed Signal Process Control. 2010 Apr;5(2):87-93. doi: 10.1016/j.bspc.2009.12.001. Biomed Signal Process Control. 2010. PMID: 23667385 Free PMC article.
-
Distinct Genomic Expression Signatures after Low-Force Electrically Induced Exercises in Persons with Spinal Cord Injury.Int J Mol Sci. 2024 Sep 23;25(18):10189. doi: 10.3390/ijms251810189. Int J Mol Sci. 2024. PMID: 39337673 Free PMC article.
-
Evidence-based prevention and treatment of osteoporosis after spinal cord injury: a systematic review.Eur Spine J. 2018 Aug;27(8):1798-1814. doi: 10.1007/s00586-017-5114-7. Epub 2017 May 11. Eur Spine J. 2018. PMID: 28497215
-
Doublet stimulation protocol to minimize musculoskeletal stress during paralyzed quadriceps muscle testing.J Appl Physiol (1985). 2008 Jun;104(6):1574-82. doi: 10.1152/japplphysiol.00892.2007. Epub 2008 Apr 24. J Appl Physiol (1985). 2008. PMID: 18436697 Free PMC article.
References
-
- Grimby G, Broberg C, Krotkiewska I, et al. Muscle fiber composition in patients with traumatic cord lesion. Scand J Rehabil Med. 1976;8:37–42. - PubMed
-
- Shields RK. Fatigability, relaxation properties, and electromyographic responses of the human paralyzed soleus muscle. J Neurophysiol. 1995;73:2195–2206. - PubMed
-
- Castro MJ, Apple DF, Jr, Hillegass EA, et al. Influence of complete spinal cord injury on skeletal muscle cross-sectional area within the first 6 months of injury. Eur J Appl Physiol. 1999;80:373–378. - PubMed
-
- Lu TW, Taylor SJ, O’Connor JJ, et al. Influence of muscle activity on the forces in the femur: an in vivo study. J Biomech. 1997;30:1101–1106. - PubMed
Publication types
MeSH terms
Grants and funding
LinkOut - more resources
Full Text Sources
Medical
