. 2007 Feb 21;27(8):2091-101.
doi: 10.1523/JNEUROSCI.3779-06.2007.

Sparse and selective odor coding by mitral/tufted neurons in the main olfactory bulb

Affiliations

Sparse and selective odor coding by mitral/tufted neurons in the main olfactory bulb

Ian G Davison et al. J Neurosci. .

Abstract

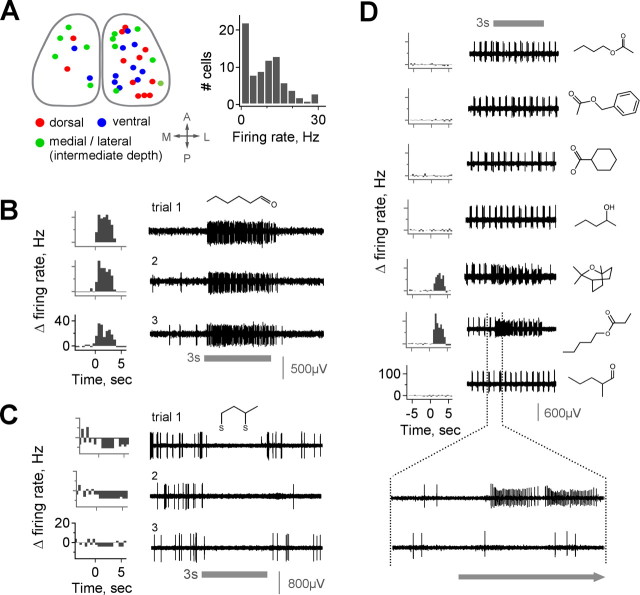
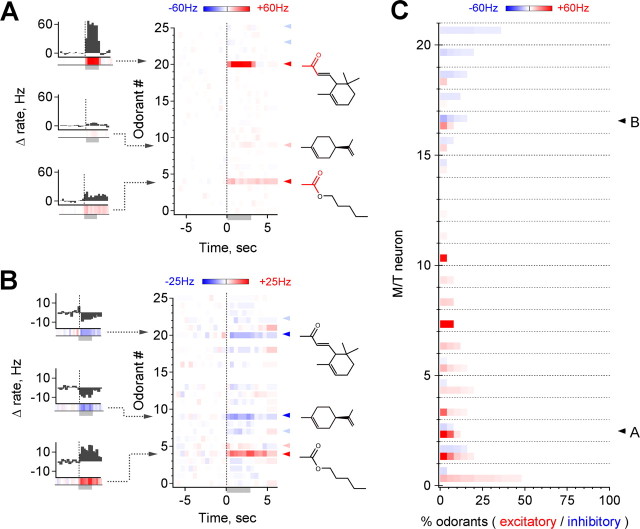
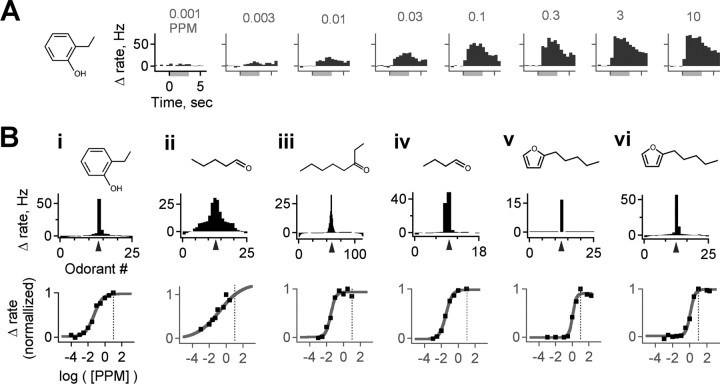
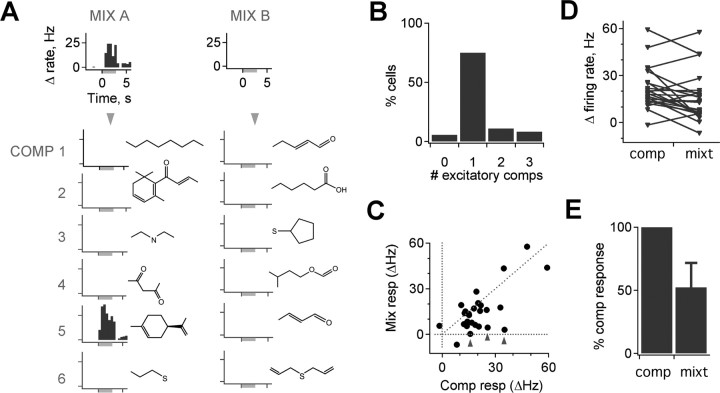
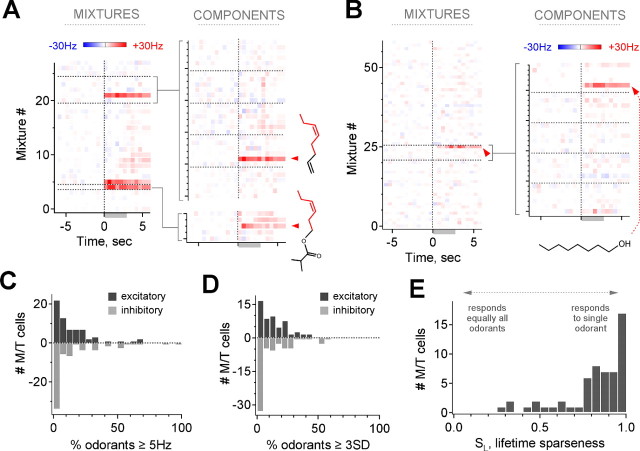
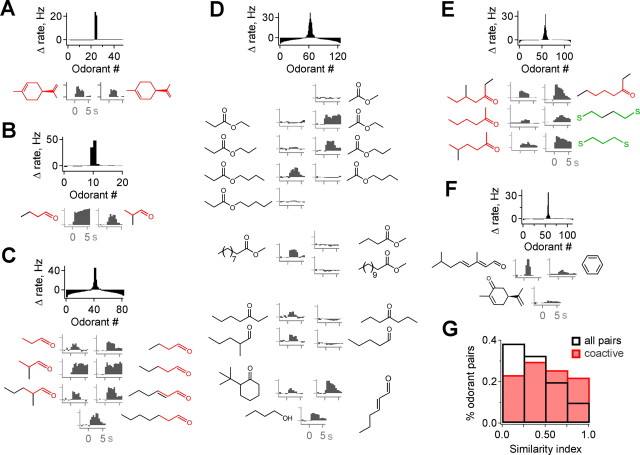
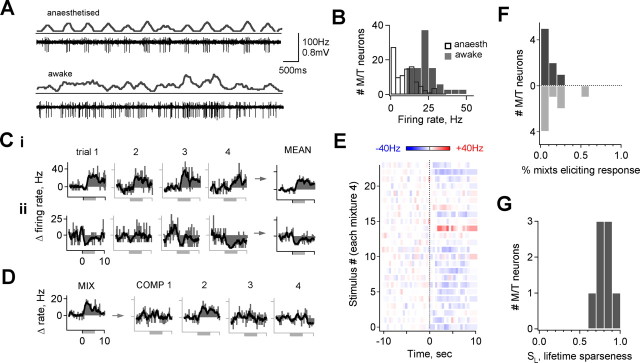
The mammalian olfactory system recognizes an enormous variety of odorants carrying a wide range of important behavioral cues. In the main olfactory bulb (MOB), odorants are ultimately represented through the action potential activity of mitral/tufted cells (M/Ts), whose selectivity and tuning to odorant molecules are therefore fundamental determinants of MOB sensory coding. However, the sheer number and diversity of discrete olfactory stimuli has been a major barrier to comprehensively evaluating M/T selectivity. To address this issue, we assessed M/T odorant responses in anesthetized mice to a 348-odorant panel widely and systematically distributed throughout chemical space, presented both individually and in mixtures at behaviorally relevant concentrations. We found that M/T activation by odorants was markedly selective, with neurons responding robustly, sensitively, and reliably to only a highly restricted subset of stimuli. Multiple odorants activating a single neuron commonly shared clear structural similarity, but M/T tuning also frequently extended beyond obviously defined chemical categories. Cells typically responded to effective compounds presented both individually and in mixtures, although firing rates evoked by mixtures typically showed partial suppression. Response selectivity was further confirmed in awake animals by chronic recordings of M/Ts. These data indicate that individual M/Ts encode specific odorant attributes shared by only a small fraction of compounds and imply that the MOB relays the collective molecular features of an odorant stimulus through a restricted set of M/Ts, each narrowly tuned to a particular stimulus characteristic.


Figures

Figure 1.
Figure 1.
Robust M/T activation by specific odorants. A, Composite map showing a dorsal view of recording sites, which were widely distributed on the dorsal, ventral, and medial/lateral MOB surfaces to avoid sampling bias. M/Ts have a broad range of spontaneous firing rates, from ∼0 to nearly 30 Hz; histogram shows population distribution. B, C, Both excitatory (B) and inhibitory (C) M/T responses are sustained during odorant presentation and consistent over multiple trials separated by extended time periods (B, C show separate cells). PSTHs (left) show firing rates calculated in 500 ms bins. D, Raw data for five representative ineffective odorants (methyl butyrate, cyclohexanecarboxylic acid, benzyl acetate, 2-pentanol, and 2-methylvaleraldehyde) and two odorants evoking strong responses (eucalyptol and pentyl propionate). Bottom trace shows firing on expanded timescale. Firing rates exceed 150 Hz for some stimuli, illustrating the range of sensitivity of M/Ts to different odorants. Gray bar indicates odor; all stimuli presented at 10 ppm (see Materials and Methods). A, Anterior; D, dorsal; L, lateral; P, posterior.
Figure 2.
Figure 2.
M/T odorant responses are highly selective. A, Example of a neuron activated by 3 of 25 odorants. Each horizontal line represents a color-coded PSTH averaged over three trials, illustrated to the left; red and blue arrowheads indicate suprathreshold activation and suppression, respectively. Note common chemical features highlighted in red, as well as the range of response strengths and detection of weak responses. B, Suppressive responses are also frequently stimulus specific (arrowheads as in A). Note overlap in stimuli with the neuron shown above. C, Population data for 21 cells in 10 mice. Each horizontal line shows both the fraction and strength of excitatory (red) and suppressive (blue) responses for a separate M/T to each of the 25 test odorants, ordered by intensity for each cell. Trials with changes of <5 Hz or 2.5 spikes in any 500 ms bin during presentation are considered unresponsive and are shown in white. Arrows indicates the neurons shown in A and B. A small number of cells are strongly activated by particular odorants, seen at the bottom left. Overall, only 14.1% of stimuli increase M/T firing by ≥5 Hz on average, and only 9.9% produce an increase of 10 Hz (n = 21 cells in ≥10 animals, 25 odorants per cell).
Figure 3.
Figure 3.
M/Ts are highly sensitive to odorants, with dynamic ranges well below the test concentration of our screen. A, M/T activation, in this case to 2-ethyl phenol, is graded smoothly and monotonically with stimulus intensity. The response of the cell is uniformly excitatory and sustained at all odorant concentrations, with a threshold ≤0.003 ppm. Bi–Bvi, Dose–response curves for six separate M/Ts strongly activated by different odorants. Top panels show the distribution of response strengths across odorants at 10 ppm for each neuron, as well as the structure of the most highly active compound (indicated on histogram by arrowhead). Bottom, Dose–response function for the indicated compound, showing sensitive M/T odorant detection regardless of a range of vapor pressures or molecular weights at concentrations one to three orders of magnitude below the test panel concentration (indicated by dotted line) and indicating that narrow tuning is not a result of stimuli that weakly activate MOB neurons.
Figure 4.
Figure 4.
M/T mixture responses correspond to individual compound responses. A, Left, Cells responding to mixtures (Mix) typically respond to a single component (Comp). Right, The absence of a mixture response predicts the absence of responses to individual component compounds. PSTHs show changes in firing rate for a mixture (top) and its components (bottom); left and right panels are from the same neuron. B, Histogram showing distribution of number of active components for all mixture–component data. A total of 75% of cells activated by a mixture respond to a single component compound. C, M/T firing rates are typically similar when active compounds are presented singly or in mixtures (diagonal line represents equal component and mixture responses), but, in the majority of cases, activation is slightly lower for mixtures (below the diagonal). A small number of responses were strongly suppressed when odorants were presented in mixtures compared with individually (arrowheads). D, Pairwise comparison of firing rates evoked by components and mixtures. E, Average strength of mixture responses is lower than that for single compounds (52.4 ± 19.3%, mean ± SEM; p < 0.02, t test; n = 26).
Figure 5.
Figure 5.
Extended screening using odorant mixtures reveals the extent of M/T specificity. A, Example of mixture screening and selectivity. Mixture responses (left; 28 mixtures, 168 odorants) predict component responses (right); likewise, the absence of a mixture response predicts the same for components. Red arrowheads and structures indicate common features of the two most highly active odorants, cis-4-heptenal (top) and Verdural Extra (bottom). B, Screening of a second neuron illustrating the extent of M/T selectivity (58 mixtures, 348 odorants). C, D, Distribution of selectivity across explicitly tested odorants for all neurons. Most cells respond to ≤20% of individual odorants (C, median 8.8%, mean 14.2%, responding at ≥5 Hz/any time bin; D, median 12%, mean 18.9%, responding at ≥3 SDs/any time bin). E, Distribution of lifetime sparseness for all cells, measuring the degree of selectivity for a single stimulus as indicated. Most cells have high sparseness, indicating that they are selectively activated by a small fraction of odorants (median and mean SL, 0.86 and 0.81, respectively).
Figure 6.
Figure 6.
Molecular structures of compounds coactivating M/Ts. A–C, Multiple odorants producing activation of an individual neuron frequently share common functional groups or clear structural overlap. Top, Distribution of response strengths across odorants; compounds shown below are highlighted in red. Bottom, Structures of the most highly active odorants (left), with common features shown in color, and PSTHs showing the activity evoked by each (right). D, M/Ts further discriminate among highly similar odorants, suggesting that global molecular shape also influences tuning. Although receptive ranges are highly restricted, they also extend to compounds with a variety of functional groups and carbon chain structures. E, Example in which subsets of coactive compounds are similar to each other (red and green structures), but similarity is not consistent across the entire group, indicating that the features activating M/Ts are not obvious from simplified structural diagrams or limited to clear chemical categories. F, Occasionally, coactive odorants were not obviously similar, emphasizing the requirement for extended sampling to determine tuning. G, Distribution of molecular similarity for coactive odorants (red) compared with the distribution for all possible pairwise combinations of odorants in the screen (black). The population of coactive odorants is significantly more similar than the full panel (p < 10−6, Kolmogorov–Smirnov test; 169 pairs of coactive odorants).
Figure 7.
Figure 7.
M/T odorant responses are also selective in alert mice. A, Comparison of M/T activity recorded using chronically implanted microdrives under anesthesia (top) and during active investigation (bottom), showing increased activity and variability. B, Distribution of unstimulated firing rates for all neurons recorded in awake animals (solid gray bars) compared with anesthesia (open black bars; mean, 23.2 ± 8.0 vs 9.3 ± 7.6 Hz; p < 10−12, t test). C, Odorant-evoked firing rates for an M/T tested with repeated presentations of the same mixture (left to right), showing that responses are repeatable across multiple trials as in anesthetized animals. Two different mixtures producing activation and suppression of the same M/T are shown in i and ii, respectively. D, Evoked M/T firing rates for an effective mixture (left) and individual components (right). Neurons activated by a mixture also typically responded to single components. E, M/T tested with 25 mixtures, averaged over four trials. This neuron was activated by a single stimulus but was also atypically inhibited by the majority of mixtures. F, G, Population selectivity measurements for M/Ts recorded in alert animals. Cells were excited or inhibited by 10.0 ± 2.8 and 16.1 ± 6.2% of mixtures, respectively (mean change in firing rate ≥5 Hz). Mean lifetime sparseness SL = 0.79 ± 0.04 (mean ± SE; n = 8 cells in 5 animals).

References

    1. Araneda RC, Peterlin Z, Zhang X, Chesler A, Firestein S. A pharmacological profile of the aldehyde receptor repertoire in rat olfactory epithelium. J Physiol (Lond) 2004;555:743–756. - PMC - PubMed
    1. Aungst JL, Heyward PM, Puche AC, Karnup SV, Hayar A, Szabo G, Shipley MT. Centre-surround inhibition among olfactory bulb glomeruli. Nature. 2003;426:623–629. - PubMed
    1. Bargmann C. Comparative chemosensation from receptors to ecology. Nature. 2006;444:295–301. - PubMed
    1. Bhalla US, Bower JM. Multiday recordings from olfactory bulb neurons in awake freely moving rats: spatially and temporally organized variability in odorant response properties. J Comput Neurosci. 1997;4:221–256. - PubMed
    1. Bozza T, Feinstein P, Zheng C, Mombaerts P. Odorant receptor expression defines functional units in the mouse olfactory system. J Neurosci. 2002;22:3033–3043. - PMC - PubMed

Publication types

LinkOut - more resources