. 2007 Feb 21;27(8):2145-9.
doi: 10.1523/JNEUROSCI.4641-06.2007.

GABAergic neurons are less selective to stimulus orientation than excitatory neurons in layer II/III of visual cortex, as revealed by in vivo functional Ca2+ imaging in transgenic mice

Affiliations

GABAergic neurons are less selective to stimulus orientation than excitatory neurons in layer II/III of visual cortex, as revealed by in vivo functional Ca2+ imaging in transgenic mice

Kazuhiro Sohya et al. J Neurosci. .

Abstract

Most neurons in the visual cortex are selectively responsive to visual stimulation of a narrow range of orientations, and GABAergic neurons are considered to play a role in the formation of such orientation selectivity. This suggests that response properties of GABAergic neurons may be different from those of excitatory neurons. This view remains unproved, however. To address this issue, we applied in vivo two-photon functional Ca2+ imaging to transgenic mice, in which GABAergic neurons express enhanced green fluorescent protein. Astroglia were stained by an astrocyte-specific dye. The three types of cells, GABAergic neurons, excitatory neurons, and astrocytes, in layer II/III of the visual cortex were differentially identified by using different wavelengths of excitation light and a dichroic mirror for emitted fluorescence, and their responses to moving visual stimuli at different orientations were measured with changes in the intensity of fluorescence of a Ca2+-sensitive dye. We found that almost all GABAergic neurons have orientation-insensitive responses, whereas most of excitatory neurons have orientation-selective responses.


Figures

Figure 1.
Figure 1.
Spectra of emission light (left) and two-photon excitation (TPE) cross section (right) for the three fluorescent dyes. Three curves in the left half schematically show the intensity of fluorescence emitted from each of the dyes as values normalized to the maximum, modified from Fluorescence Spectra Viewer (Invitrogen). The ordinates on the left and right sides apply to the three curves in the left half and TPE cross-section spectra curves in the right half, respectively. Two dashed red curves schematically show TPE cross-section spectra of fura-2 bound and not bound with Ca2+, modified from Xu et al. (1996). The dotted curve for EGFP schematically shows its TPE cross-section spectra, modified also from Xu et al. (1996). The solid curve for SR101 schematically shows its TPE cross-section spectra measured at 780–960 nm excitation wavelength in aqueous solution. TPE cross-section values of Goeppert-Mayer unit (GM) of SR101 were obtained by comparing the measured intensity of fluorescence with that of Rhodamine B, on the following assumptions: the two-photon absorption cross section of Rhodamine B in aqueous solution is the same as that in methanol solution (210 GM at 840 nm two-photon excitation); the two-photon fluorescence quantum efficiency of Rhodamine B is the same as its one-photon fluorescence quantum efficiency (0.7); and the sample refractive index in aqueous solution is the same as that in methanol solution (Albota et al., 1998).
Figure 2.
Figure 2.
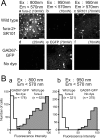
Separate visualization of three groups of cells. A, Visibility or invisibility of cortical cells of wild-type (top) and GAD67-GFP (Δneo; bottom) mice under the conditions indicated at the top. The cortex of the former mice was loaded with fura-2 and SR101, whereas that of the latter was not loaded with any dye. Scale bars in the images in the left column indicate 30 μm and apply to the images in the same row. The plane of the depth was 155 μm in a–c and 150 μm in d–f. B, Distributions of the emitted fluorescence intensity of EGFP-expressing neurons in the visual cortex of GAD67-GFP (Δneo) mice and that of fura-2-loaded neurons in the visual cortex of wild-type mice, at excitation wavelengths of 800 nm (a) and 950 nm (b). Fluorescence intensity was normalized to the maximum value. The PMT gain was constant in the same excitation and emission conditions.
Figure 3.
Figure 3.
In vivo imaging of visual cortical neurons and examples of visual responses of neurons and neuropils. A, In vivo images of three focal planes of a GAD67-GFP (Δneo) mouse. The depth from the cortical surface is indicated on the left side of each plane. Each plane covers 190 × 190 μm. Green and red cells represent GABAergic neurons and astrocytes, respectively. B, The plane of the depth of 160 μm is indicated. Scale bar, 30 μm. C, Magnified image of the rectangular area shown in B. Numbers indicate neurons whose responses are shown in D. a–c indicate neuropil areas, in which responses were recorded as shown in D. Scale bar, 10 μm. D, Responses of cells 1–3 and neuropil areas a–c to eight different patterns of visual stimuli, as shown at the top. Each trace represents the average of five sweeps. Calibration bars on the right indicate 5% (−ΔF/F0) and 10 s. E, Polar plots of visual responses of cells 1–3, as indicated.
Figure 4.
Figure 4.
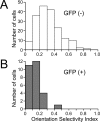
A, B, Distribution of OSI of visual responses of GFP-negative and -positive neurons, respectively. The total numbers of cells in A and B are 181 and 28, respectively.

References

    1. Albota MA, Xu C, Webb WW. Two-photon fluorescence excitation cross sections of biomolecular probes from 690 to 960 nm. Appl Opt. 1998;37:7352–7356. - PubMed
    1. Anderson JS, Carandini M, Ferster D. Orientation tuning of input conductance, excitation, and inhibition in cat primary visual cortex. J Neurophysiol. 2000;84:909–926. - PubMed
    1. Chapman B, Zahs KR, Stryker MP. Relation of cortical cell orientation selectivity to alignment of receptive fields of the geniculocortical afferents that arborize within a single orientation column in ferret visual cortex. J Neurosci. 1991;11:1347–1358. - PMC - PubMed
    1. Draeger UC. Receptive fields of single cells and topography in mouse visual cortex. J Comp Neurol. 1975;160:269–287. - PubMed
    1. Ferster D. Orientation selectivity of synaptic potentials in neurons of cat primary visual cortex. J Neurosci. 1986;6:1284–1301. - PMC - PubMed

LinkOut - more resources