

Residue-level prediction of DNA-binding sites and its application on DNA-binding protein predictions
- PMID: 17316627
- PMCID: PMC1993824
- DOI: 10.1016/j.febslet.2007.01.086
Residue-level prediction of DNA-binding sites and its application on DNA-binding protein predictions
Abstract
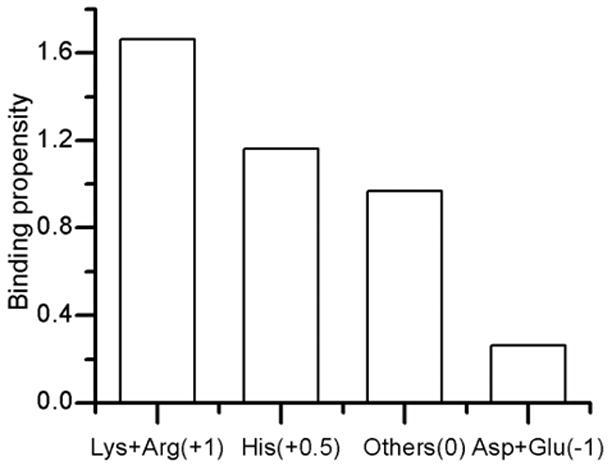
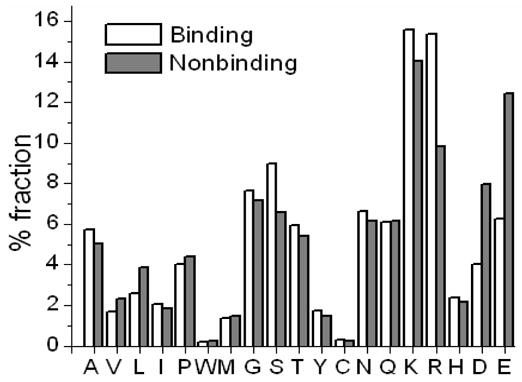
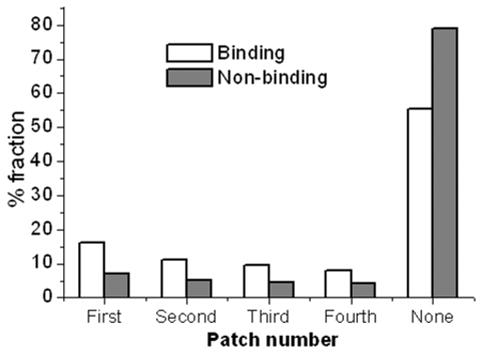
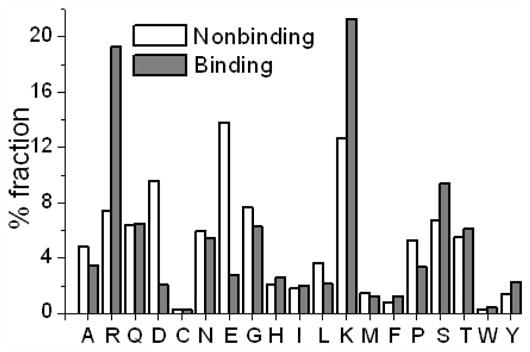
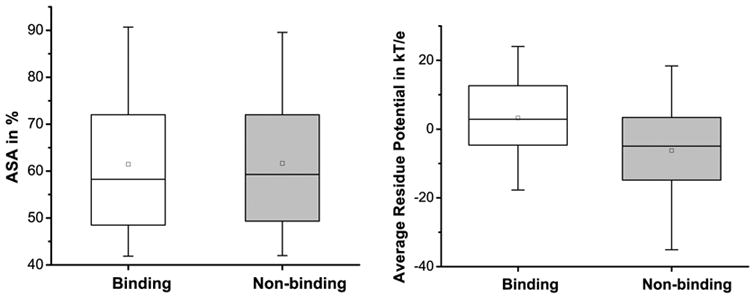
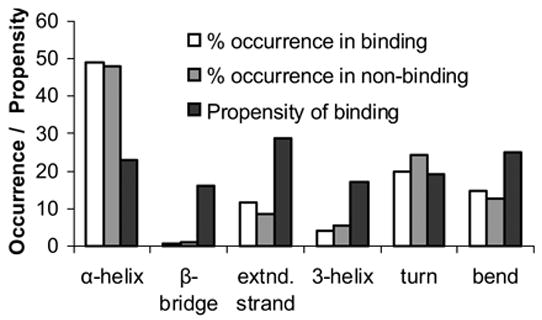
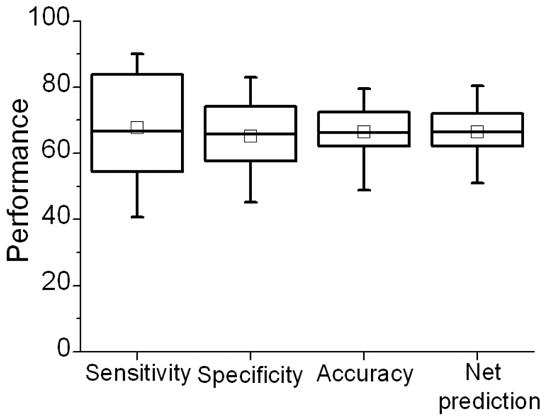
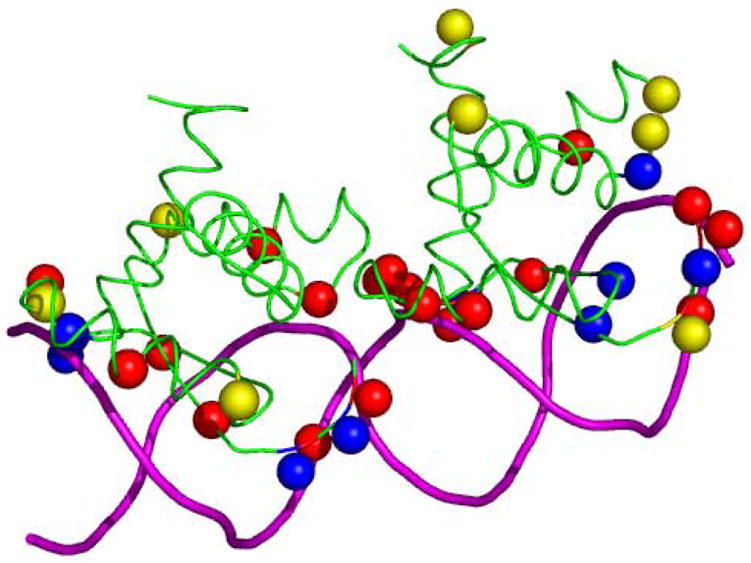
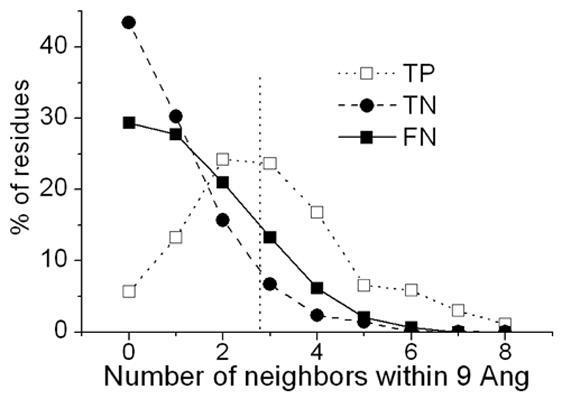
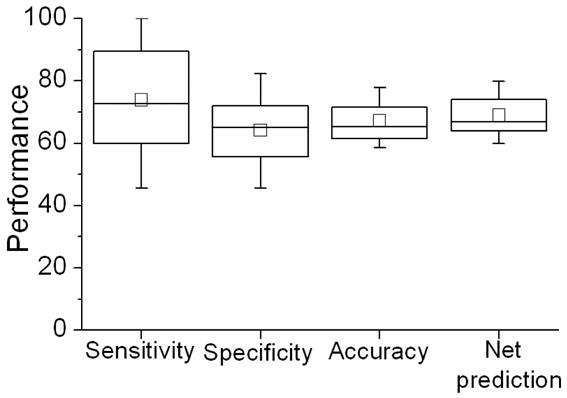
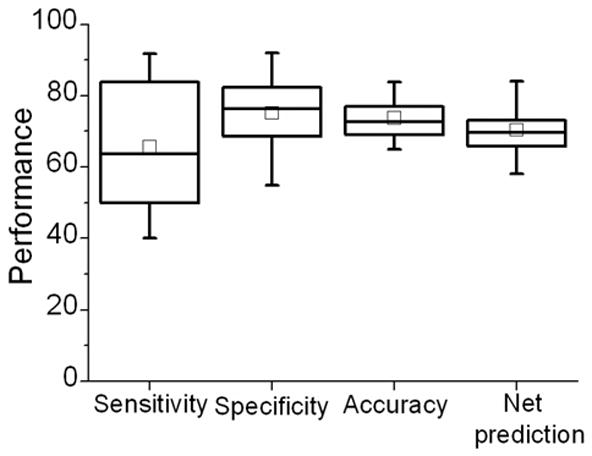
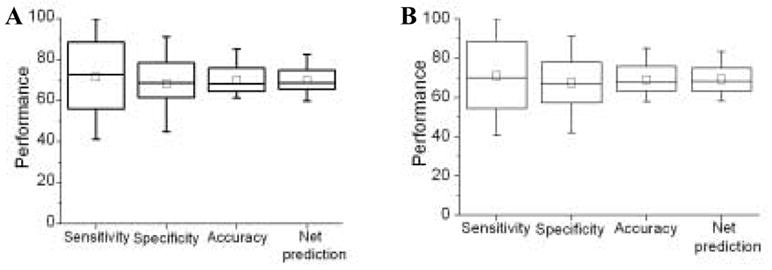
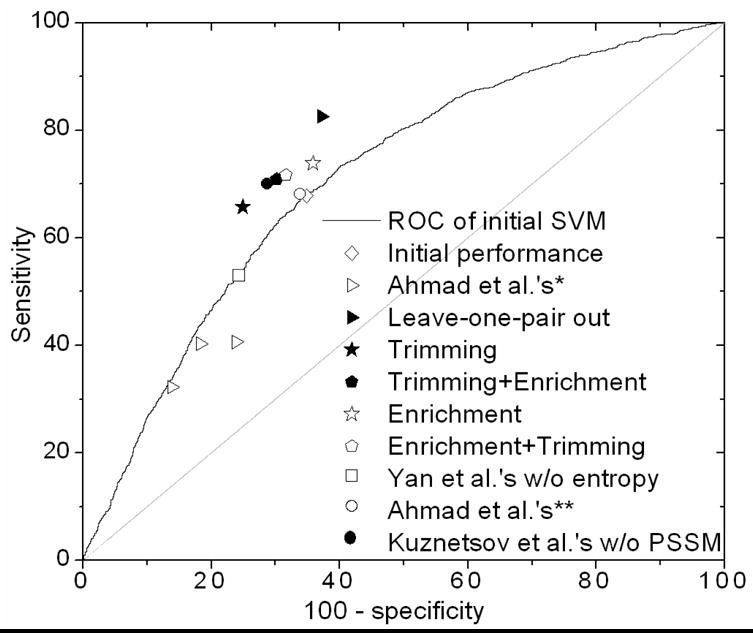
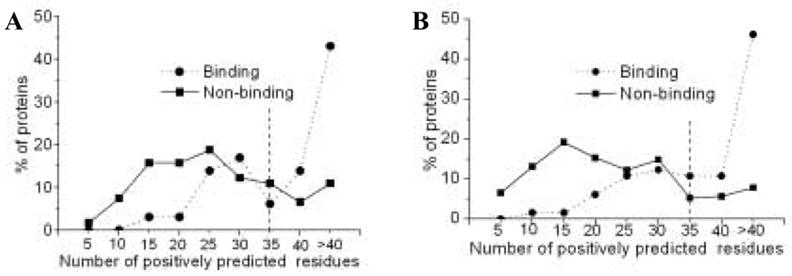
Protein-DNA interactions are crucial to many cellular activities such as expression-control and DNA-repair. These interactions between amino acids and nucleotides are highly specific and any aberrance at the binding site can render the interaction completely incompetent. In this study, we have three aims focusing on DNA-binding residues on the protein surface: to develop an automated approach for fast and reliable recognition of DNA-binding sites; to improve the prediction by distance-dependent refinement; use these predictions to identify DNA-binding proteins. We use a support vector machines (SVM)-based approach to harness the features of the DNA-binding residues to distinguish them from non-binding residues. Features used for distinction include the residue's identity, charge, solvent accessibility, average potential, the secondary structure it is embedded in, neighboring residues, and location in a cationic patch. These features collected from 50 proteins are used to train SVM. Testing is then performed on another set of 37 proteins, much larger than any testing set used in previous studies. The testing set has no more than 20% sequence identity not only among its pairs, but also with the proteins in the training set, thus removing any undesired redundancy due to homology. This set also has proteins with an unseen DNA-binding structural class not present in the training set. With the above features, an accuracy of 66% with balanced sensitivity and specificity is achieved without relying on homology or evolutionary information. We then develop a post-processing scheme to improve the prediction using the relative location of the predicted residues. Balanced success is then achieved with average sensitivity, specificity and accuracy pegged at 71.3%, 69.3% and 70.5%, respectively. Average net prediction is also around 70%. Finally, we show that the number of predicted DNA-binding residues can be used to differentiate DNA-binding proteins from non-DNA-binding proteins with an accuracy of 78%. Results presented here demonstrate that machine-learning can be applied to automated identification of DNA-binding residues and that the success rate can be ameliorated as more features are added. Such functional site prediction protocols can be useful in guiding consequent works such as site-directed mutagenesis and macromolecular docking.
Figures
Similar articles
-
Analysis and prediction of DNA-binding proteins and their binding residues based on composition, sequence and structural information.Bioinformatics. 2004 Mar 1;20(4):477-86. doi: 10.1093/bioinformatics/btg432. Epub 2004 Jan 22. Bioinformatics. 2004. PMID: 14990443
-
BindN: a web-based tool for efficient prediction of DNA and RNA binding sites in amino acid sequences.Nucleic Acids Res. 2006 Jul 1;34(Web Server issue):W243-8. doi: 10.1093/nar/gkl298. Nucleic Acids Res. 2006. PMID: 16845003 Free PMC article.
-
Using evolutionary and structural information to predict DNA-binding sites on DNA-binding proteins.Proteins. 2006 Jul 1;64(1):19-27. doi: 10.1002/prot.20977. Proteins. 2006. PMID: 16568445
-
An overview of the prediction of protein DNA-binding sites.Int J Mol Sci. 2015 Mar 6;16(3):5194-215. doi: 10.3390/ijms16035194. Int J Mol Sci. 2015. PMID: 25756377 Free PMC article. Review.
-
A comprehensive comparative review of sequence-based predictors of DNA- and RNA-binding residues.Brief Bioinform. 2016 Jan;17(1):88-105. doi: 10.1093/bib/bbv023. Epub 2015 May 1. Brief Bioinform. 2016. PMID: 25935161 Review.
Cited by
-
Functional Site Discovery From Incomplete Training Data: A Case Study With Nucleic Acid-Binding Proteins.Front Genet. 2019 Aug 30;10:729. doi: 10.3389/fgene.2019.00729. eCollection 2019. Front Genet. 2019. PMID: 31543893 Free PMC article.
-
Predicting DNA-binding proteins and binding residues by complex structure prediction and application to human proteome.PLoS One. 2014 May 2;9(5):e96694. doi: 10.1371/journal.pone.0096694. eCollection 2014. PLoS One. 2014. PMID: 24792350 Free PMC article.
-
Novel approach for selecting the best predictor for identifying the binding sites in DNA binding proteins.Nucleic Acids Res. 2013 Sep;41(16):7606-14. doi: 10.1093/nar/gkt544. Epub 2013 Jun 20. Nucleic Acids Res. 2013. PMID: 23788679 Free PMC article.
-
EGPDI: identifying protein-DNA binding sites based on multi-view graph embedding fusion.Brief Bioinform. 2024 May 23;25(4):bbae330. doi: 10.1093/bib/bbae330. Brief Bioinform. 2024. PMID: 38975896 Free PMC article.
-
Improved detection of DNA-binding proteins via compression technology on PSSM information.PLoS One. 2017 Sep 29;12(9):e0185587. doi: 10.1371/journal.pone.0185587. eCollection 2017. PLoS One. 2017. PMID: 28961273 Free PMC article.
References
-
- Jones S, Heyningen Pv, Berman HM, Thornton JM. Protein-DNA interactions: A Structural Analysis. J Mol Biol. 1999;287:877–896. - PubMed
-
- Ren B, et al. Genome-wide location and function of DNA binding proteins. Science. 2000;290:2306–9. - PubMed
-
- Stormo GD. DNA binding sites: representation and discovery. Bioinformatics. 2000;16:16–23. - PubMed
-
- Stormo G. DNA binding sites: representation and discovery. Bioinformatics. 2000;16:16–23. - PubMed
Publication types
MeSH terms
Substances
Grants and funding
LinkOut - more resources
Full Text Sources
