

Towards fully automated structure-based function prediction in structural genomics: a case study
- PMID: 17316683
- PMCID: PMC2566530
- DOI: 10.1016/j.jmb.2007.01.063
Towards fully automated structure-based function prediction in structural genomics: a case study
Abstract
As the global Structural Genomics projects have picked up pace, the number of structures annotated in the Protein Data Bank as hypothetical protein or unknown function has grown significantly. A major challenge now involves the development of computational methods to assign functions to these proteins accurately and automatically. As part of the Midwest Center for Structural Genomics (MCSG) we have developed a fully automated functional analysis server, ProFunc, which performs a battery of analyses on a submitted structure. The analyses combine a number of sequence-based and structure-based methods to identify functional clues. After the first stage of the Protein Structure Initiative (PSI), we review the success of the pipeline and the importance of structure-based function prediction. As a dataset, we have chosen all structures solved by the MCSG during the 5 years of the first PSI. Our analysis suggests that two of the structure-based methods are particularly successful and provide examples of local similarity that is difficult to identify using current sequence-based methods. No one method is successful in all cases, so, through the use of a number of complementary sequence and structural approaches, the ProFunc server increases the chances that at least one method will find a significant hit that can help elucidate function. Manual assessment of the results is a time-consuming process and subject to individual interpretation and human error. We present a method based on the Gene Ontology (GO) schema using GO-slims that can allow the automated assessment of hits with a success rate approaching that of expert manual assessment.
Figures
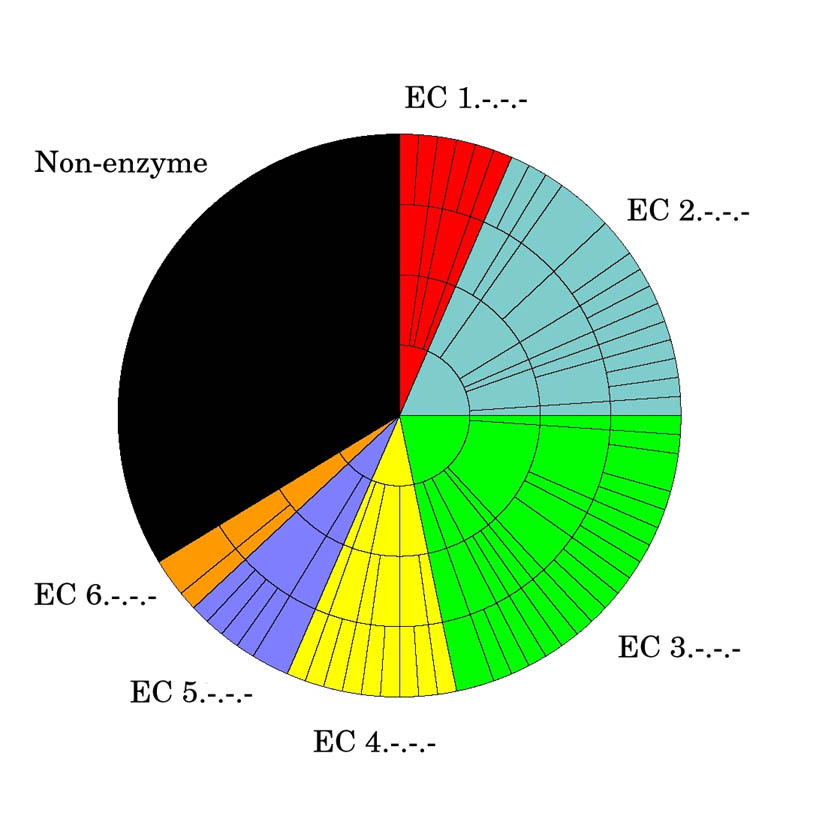
Red = E.C. 1.-.-.- (Oxidoreductases)
Blue = E.C. 2.-.-.- (Transferases)
Green = E.C. 3.-.-.- (Hydrolases)
Yellow = E.C. 4.-.-.- (Lyases)
Purple = E.C. 5.-.-.- (Isomerases)
Orange = E.C. 6.-.-.- (Ligases)
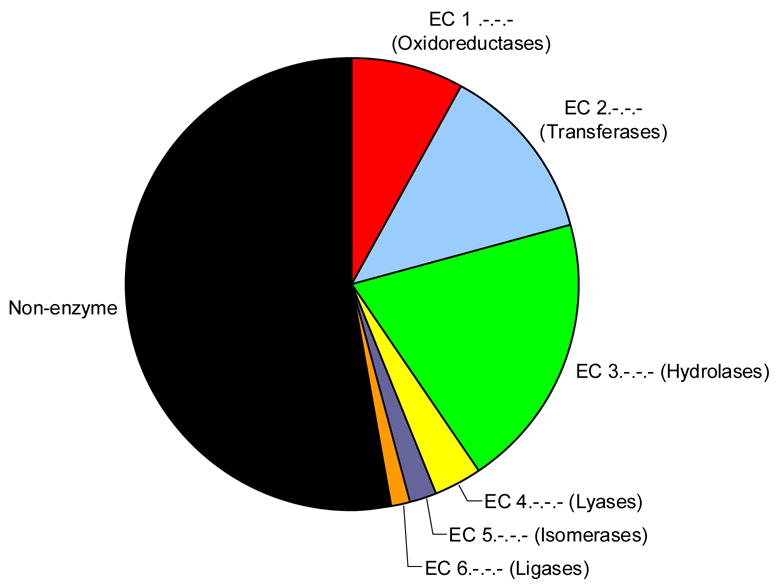
Red = E.C. 1.-.-.- (Oxidoreductases)
Blue = E.C. 2.-.-.- (Transferases)
Green = E.C. 3.-.-.- (Hydrolases)
Yellow = E.C. 4.-.-.- (Lyases)
Purple = E.C. 5.-.-.- (Isomerases)
Orange = E.C. 6.-.-.- (Ligases)
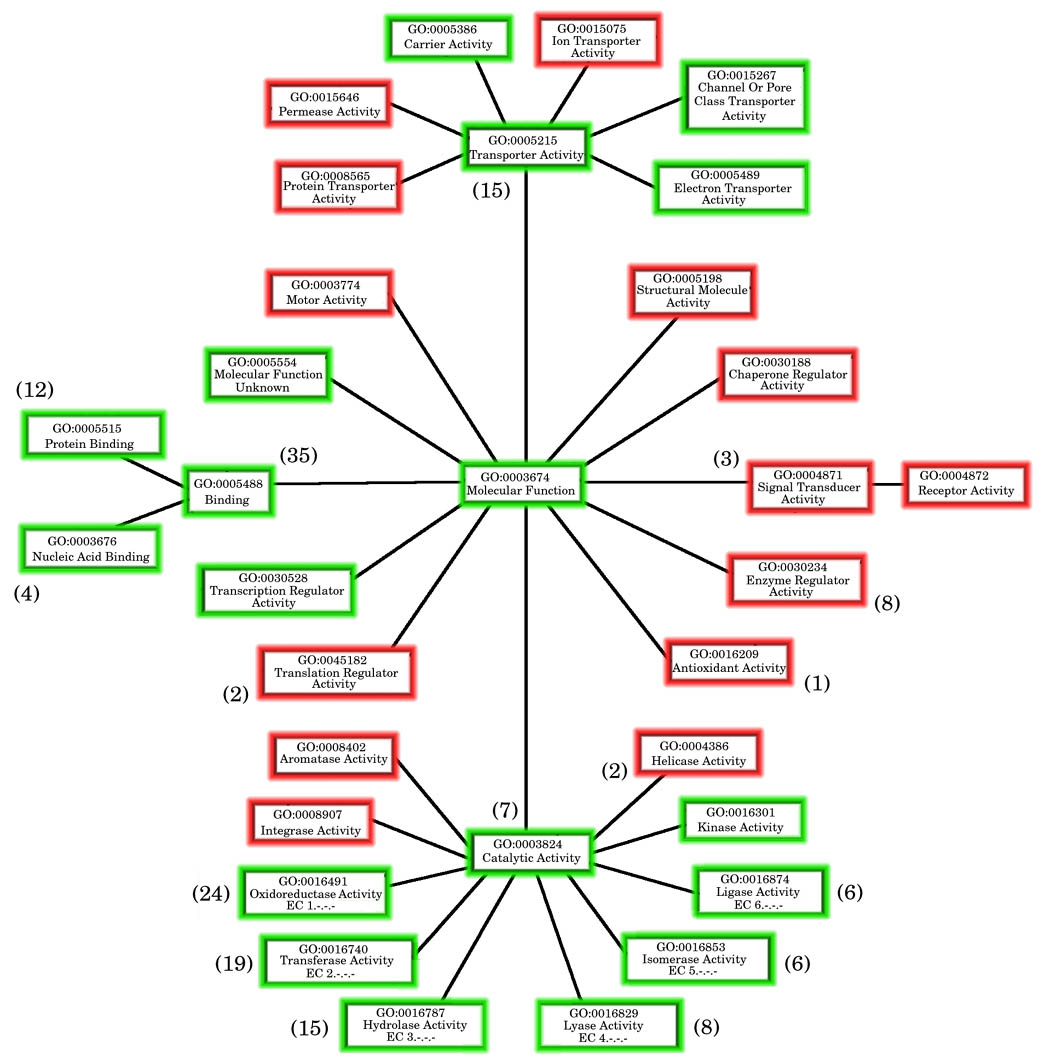
Red = E.C. 1.-.-.- (Oxidoreductases)
Blue = E.C. 2.-.-.- (Transferases)
Green = E.C. 3.-.-.- (Hydrolases)
Yellow = E.C. 4.-.-.- (Lyases)
Purple = E.C. 5.-.-.- (Isomerases)
Orange = E.C. 6.-.-.- (Ligases)
References
Publication types
MeSH terms
Grants and funding
LinkOut - more resources
Full Text Sources
