Review
. 2007 Apr-May;23(3):267-82.
doi: 10.1016/j.reprotox.2007.01.004. Epub 2007 Jan 19.

Techniques used in studies of epigenome dysregulation due to aberrant DNA methylation: an emphasis on fetal-based adult diseases

Affiliations
Review

Techniques used in studies of epigenome dysregulation due to aberrant DNA methylation: an emphasis on fetal-based adult diseases

Shuk-mei Ho et al. Reprod Toxicol. 2007 Apr-May.

Abstract

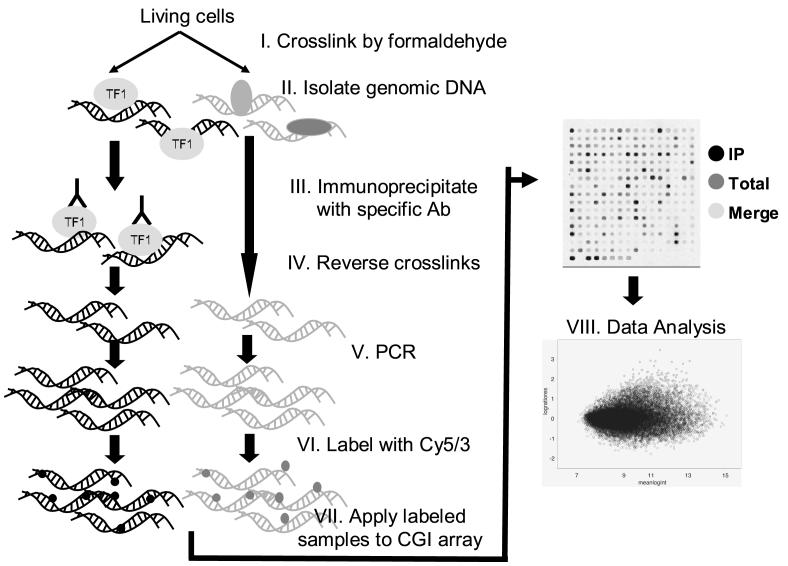
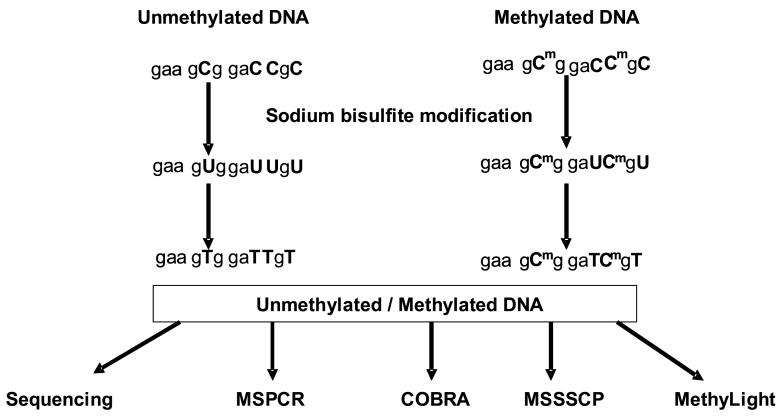
Epigenetic changes are heritable modifications that do not involve alterations in the primary DNA sequence. They regulate crucial cellular functions such as genome stability, X-chromosome inactivation, and gene imprinting. Epidemiological and experimental observations now suggest that such changes may also explain the fetal basis of adult diseases such as cancer, obesity, diabetes, cardiovascular disorders, neurological diseases, and behavioral modifications. The main molecular events known to initiate and sustain epigenetic modifications are histone modification and DNA methylation. This review specifically focuses on existing and emerging technologies used in studying DNA methylation, which occurs primarily at CpG dinucleotides in the genome. These include standard exploratory tools used for global profiling of DNA methylation and targeted gene investigation: methylation sensitive restriction fingerprinting (MSRF), restriction landmark genomic scanning (RLGS), methylation CpG island amplification-representational difference analysis (MCA-RDA), differential methylation hybridization (DMH), and cDNA microarrays combined with treatment with demethylating agents and inhibitors of histone deacetylase. The basic operating principals, resource requirements, applications, and benefits and limitations of each methodology are discussed. Validation methodologies and functional assays needed to establish the role of a CpG-rich sequence in regulating the expression of a target or candidate gene are outlined. These include in silico database searches, methylation status studies (bisulfite genomic sequencing, COBRA, MS-PCR, MS-SSCP), gene expression studies, and promoter activity analyses. Our intention is to give readers a starting point for choosing methodologies and to suggest a workflow to follow during their investigations. We believe studies of epigenetic changes such as DNA methylation hold great promise in understanding the early origins of adult diseases and in advancing their diagnosis, prevention, and treatment.


Figures

Figure 1
Figure 1
DNA methylation machinery and transcriptional repression. A) Diagrams showing the biochemical pathways for cytosine methylation, demethylation, and mutagenesis of cytosine and 5-metC [33]. DNA methylation by addition of a methyl group to carbon 5 position of the cytosine ring is catalyzed by DNA methyltransferases (DNMTs), and demethylation is catalyzed by demethylase. 5-Methyl cytosine (5meC) undergoes hydrolytic deamination to thymidine. Mutation at CpG occurs because 5meC is more susceptible than cytosine to deamination and because some of the T-G mismatches produced by deamination are poorly repaired. B) Methylation at cytosine of DNA blocks transcription. Singal and Ginder have proposed three mechanisms of how methylation inhibits gene transcription [33]. Details are in the text.
Figure 2
Figure 2
The work-flow chart outlines how to discover the methylated genes in a step-by-step manner. First, one of the methylation profiling techniques is used to pool out several candidate clones showing differential methylation patterns. After subcloning and sequencing, candidate clones are identified by aligning sequences into BLAST (from NCBI) or BLAT (from UCSC) database. Next, in silico database analysis, such as promoter and CpG island search on the candidate clones, is done to characterize the gene structure and design primers for subsequent data validation assays. Several methods, such as RT-PCR, Western blotting analysis, bisulfite sequencing (BS), methylation-specific PCR (MSPCR), combined bisulfite restriction analysis (COBRA), methylation-specific single strand conformation polymorphism (MSSSCP), and MethyLight, are used to validate the methylation level and gene expression of the target genes. If target genes are ready the methylation studies, it is not necessary to start from the first step. Methylation studies start from any step, depending on the researcher's needs.
Figure 3
Figure 3
Principle of methylation sensitive restriction fingerprinting (MSRF). A) Methylated cellular DNA that will be digested by enzymes MseI and BstUI and DNA with an intact methyl group can be amplified in PCR. B) A schematic diagram depicting expected results. In this comparison, the methylation status was defined by comparing samples A and B. If there is no difference in methylation status, no difference in methylation status will be observed for both cases. If that candidate is being methylated in sample A, none of the BstUI sites in the CpG-rich sequence will be digested and they can be amplified in PCR. If vice versa, DNA fragments will be absent in the lane of sample A (MseI/BstUI) if this candidate is unmethylated in sample A.
Figure 4
Figure 4
Diagram showing the procedures of restriction landmark genomic scanning (RLGS). Methylation detection in the RLGS profile depends on the methylation sensitivity of NotI. NotI, which recognizes CG-rich regions and cannot cleave DNA sequences when 5-cytosine is methylated, acts as the landmark in the profiles. Three types of methylation status are expected, depending on which allele is methylated. mNotI represents the methylated site of the enzymes. Following further endonuclease digestion of EcoRV (1D gel electrophoresis) and HinfI (2D gel electrophoresis), the RLGS profile will result in a change in spot intensity that quantitatively reflects the copy number and methylation status of the NotI fragment
Figure 5
Figure 5
Schematic diagram for methylation CpG island amplification (MCA) coupled with representational difference analysis (RDA). CpG sites are labeled as 1 to 4. In the comparison of the methylation status of sample A and sample B, CpG site 2 is methylated in both cases whereas CpG site 4 is methylated only in sample A. For MCA, unmethylated CpGs are digested by methylation-sensitive restriction enzyme (SmaI), resulting in the formation of the blunt end fragments. Those methylated CpGs are then digested with XmaI and generate sticky end fragments. Following ligation into linker and PCR amplification, amplicons of short sequences can then be directly hybridized to enable study of the methylation status of the gene of interest for which a probe is available. As shown in the figure, differential methylation of CpG sites 2 and 4 between samples A and B can be found in dot-blot analysis. Besides, MCA amplicons (i.e., fragments containing CpG site 4) showing differentially methylation status in sample A can be cloned by RDA to identify any novel candidates.
Figure 6
Figure 6
Schematic diagram for differential methylation hybridization (DMH). In brief, genomic DNA is first digested with MseI and ligated to linkers and then digested with methylation-sensitive BstUI. Both MseI or Mse/BstUI digestion products are amplified to generate probes for hybridization to a microarray that is prescreened by their CGI library array. The hybridization output is the measured intensities of the two fluorescence reporters with red (sample B) and green (sample A). Yellow spots indicate equal amounts of bound DNA from each amplicon, signifying no methylation differences between sample A and B genomes. Spots hybridized predominantly with sample B amplicon but not with sample A amplicon would appear red, which is indicative of the presence of hypermethylated CpG island loci in the tumor genome. Methylation level of each CG clone can be analyzed.
Figure 7
Figure 7
Diagram illustrating how to analyze DNA methylation by methylation-specific oligonucleotide (MSO). Genomic DNA is first modified with sodium bisulfite before the assay. The probes on the MSO array are a set of short oligonucleotides (∼20-mers) designed for specific methylated CG or unmethylated C/TG sites to test all the CpG sites within the CGI of a known gene. Both methylated and unmethylated DNA can be amplified, labeled with Cy5 dye, and then hybridized to oligonucleotide probes attached to the glass plate/membrane. Signals from MSO arrays can be recorded with a fluorescence scanner, and signal intensities between the pair of probes are compared to arrive at the percentage of methylation of the CpG within the short region represented by the oligonucleotides, usually 2−3 CpG sites [81].
Figure 8
Figure 8
Workflow of chromatin immunoprecipitation (ChIP) on DNA microarray (ChIP-chip) analysis. At first, living cells are fixed by formaldehyde crosslinking. Intact genomic DNA with transcription factors (TF) is then isolated, and the chromatin-protein complex of interest is immunoprecipitated (IP) with a specific antibody to that intact TF. After reverse crosslinking, DNA is extracted and purified before PCR to generate chromatin amplicons. Amplicons from experimental immunoprecipitation are labeled with Cy5, and Cy3 is used to label input reference amplicons. Labeled probes are applied on the CGI array for hybridization. Data can be utilized to study the interaction between particular TFs and specific CpG sites of genes.
Figure 9
Figure 9
Procedures for analysis global DNA methylation with luminometric methylation assay (LUMA). Genomic DNA is digested with combinations of restriction enzymes, EcoRI/MspI or EcoRI/HpaII, to leave the TTAA (EcoRI) and CG (HpaII [methylation-sensitive] or MspI [methylation-insensitive]) overhangs. Next, the extent of the cleavage is determined by a polymerase extension assay based on a four-step pyrosequencing reaction. Inorganic pyrophosphate (PPi) is generated at each nucleotide addition in the polymerase extension assay. Signals are generated based on the utilization of PPi in a luciferase-based reaction. The amount of light generated is directly proportional to the number of overhangs produced by respective restriction enzymes. The A and T peaks represent signals from Steps 1 and 3. The C+G peaks resulting from Step 2 illustrate HpaII or MspI cleavage. The second C+G peak originating from Step 4 is an internal control for the completion of Step 2. Unmethylated CG is cleaved by HpaII, and a CG overhang is left after the cleavage and amplified in polymerase extension. Methylation status can be determined by analyzing the HpaII/MspI ratio at CG peaks from Step 2. The HpaII/MspI ratio is close to 1 in the unmethylated sample but close to zero in the methylated sample.
Figure 10
Figure 10
Analysis of CpG methylation patterns using RNase T1 cleavage and Matrix-assisted laser desorption/ionization time-of-flight mass spectrometry (MALDI-TOF-MS). Genomic DNA is modified by sodium bisulfite to convert unmethylated cytosines to uracils followed by PCR amplification with forward primer containing a control tag and reverse primer carrying T7 promoter. RNA transcription generates G-sites at originally methylated C sites and G-specific cleavage with RNase T1 is done. Control tag is used to monitor the successful full-length transcription and followed RNase T1 cleavage. RNA fragments are subjected to MALDI-TOF analysis. By comparison of the profile of m/z values of all fragments in the samples, methylation status of genes can be found.
Figure 11
Figure 11
Different approaches can be chosen to yield the information on the overall characterization of genes showing differential methylation status. Unmethylated DNA is distinguished from methylated DNA with a sodium bisulfite modification of DNA used as a standard procedure prior to validation assays. The underlying principle is based on the ability of sodium bisulfite to deaminate cytosine (C) residues into uracil (U) in genomic DNA, whereas the methylation cytosine residues are resistant to this modification. After PCR amplication, the U residues) are amplified as thymines (Ts). Cloning and subsequent sequencing of the DNA fragments containing the CpGs then provide information on the methylation status of each C within the CpGs. Details of methylation-specific PCR (MSPCR), combined bisulfite restriction analysis (COBRA), methylation-specific single-strand conformation polymorphism (MSSSCP), and MethyLight are discussed in the text.

Similar articles

Cited by

References

    1. Liu Y, Freedman BI. Genetics of progressive renal failure in diabetic kidney disease. Kidney Int Suppl. 2005:S94–S97. - PubMed
    1. Kroll TG. Molecular events in follicular thyroid tumors. Cancer Treat Res. 2004;122:85–105. - PubMed
    1. Moore MA. Converging pathways in leukemogenesis and stem cell self-renewal. Exp Hematol. 2005;33:719–37. - PubMed
    1. Scher HI, Sawyers CL. Biology of progressive, castration-resistant prostate cancer: directed therapies targeting the androgen-receptor signaling axis. J Clin Oncol. 2005;23:8253–61. - PubMed
    1. Tusie Luna MT. Genes and type 2 diabetes mellitus. Arch Med Res. 2005;36:210–22. - PubMed

Publication types

LinkOut - more resources