. 2007 Feb 23;25(4):543-57.
doi: 10.1016/j.molcel.2007.01.011.

Phosphorylation of HuR by Chk2 regulates SIRT1 expression

Affiliations

Phosphorylation of HuR by Chk2 regulates SIRT1 expression

Kotb Abdelmohsen et al. Mol Cell. .

Abstract

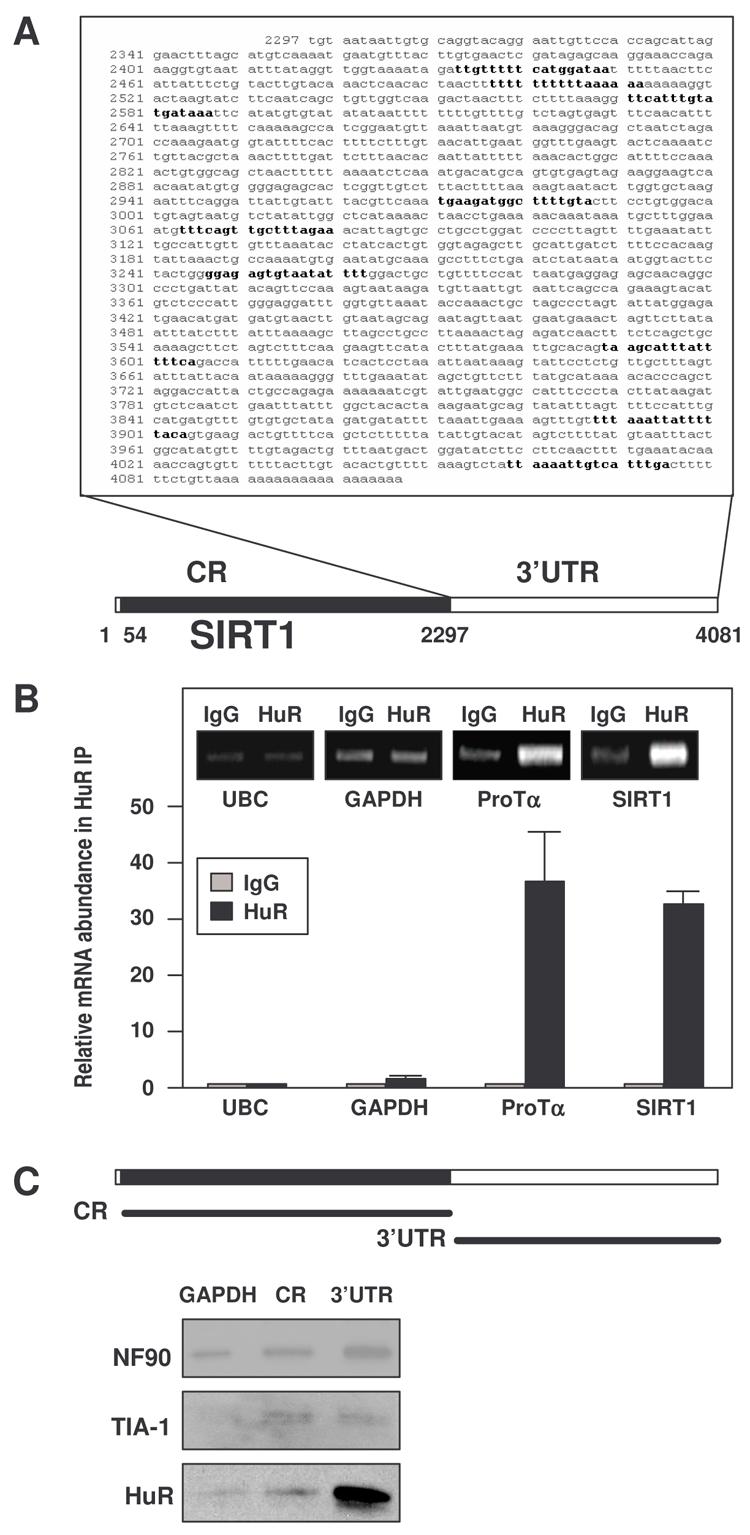
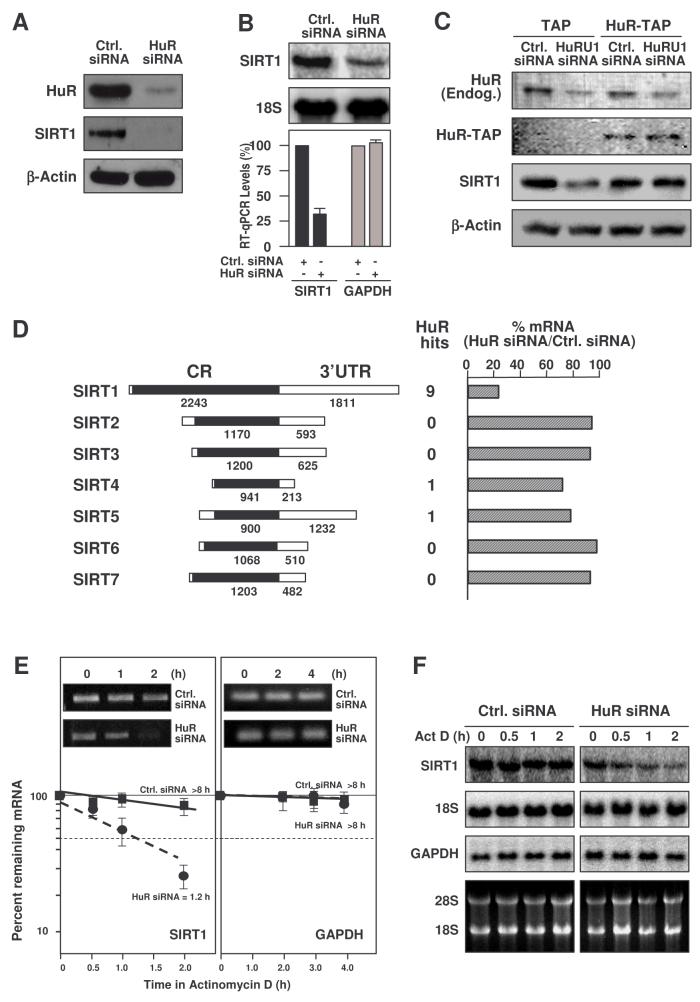
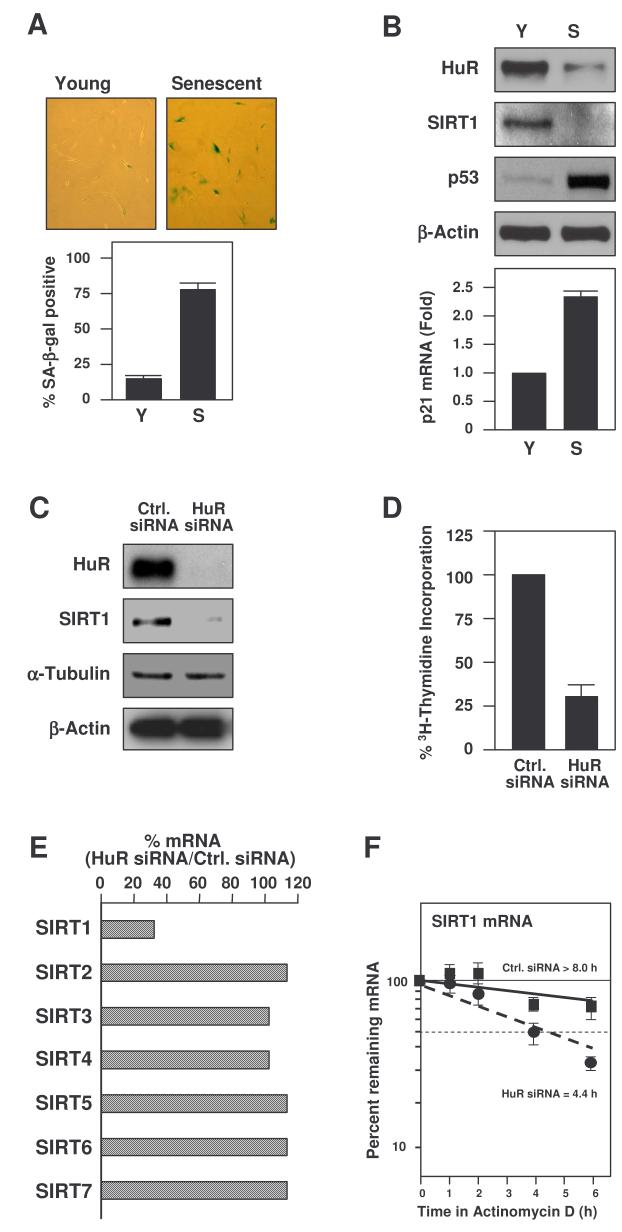
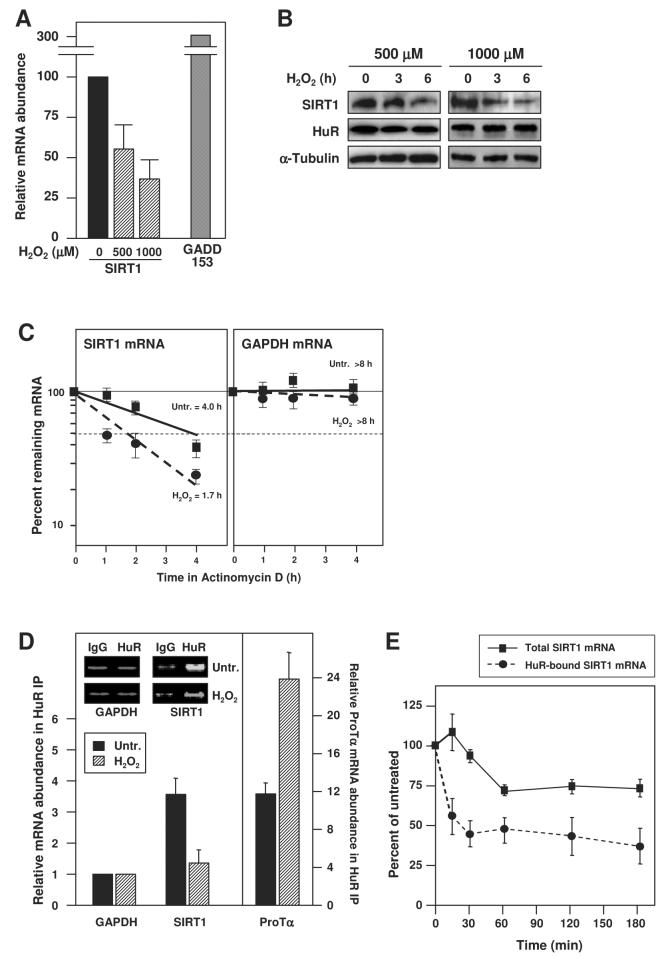
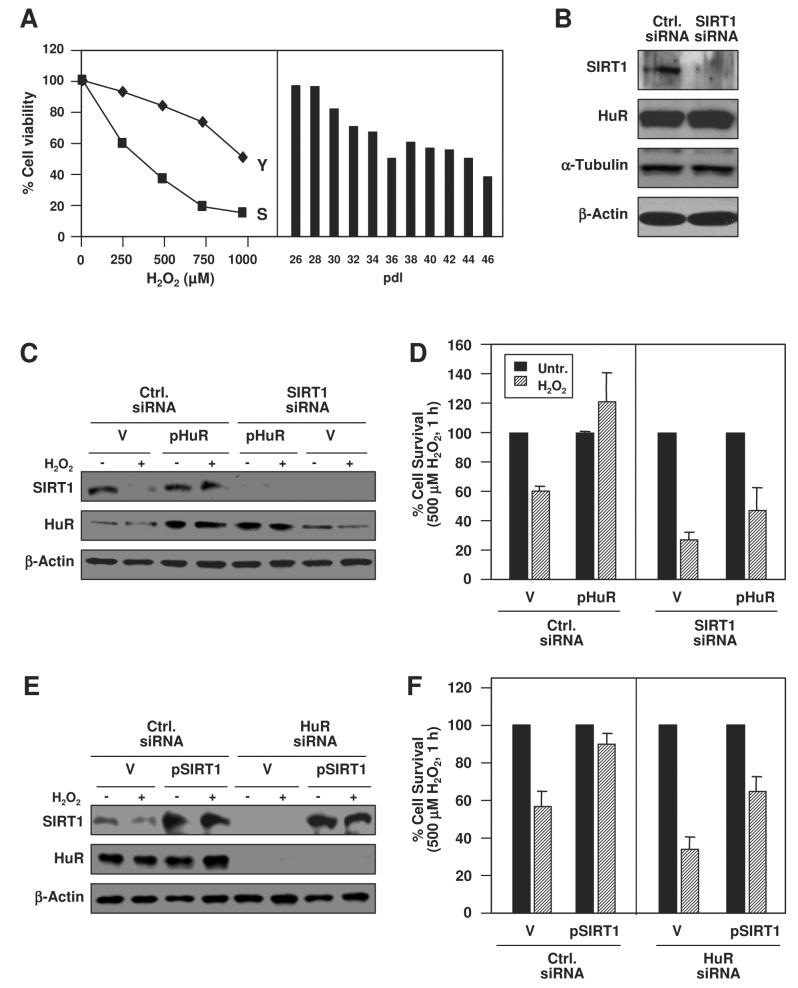
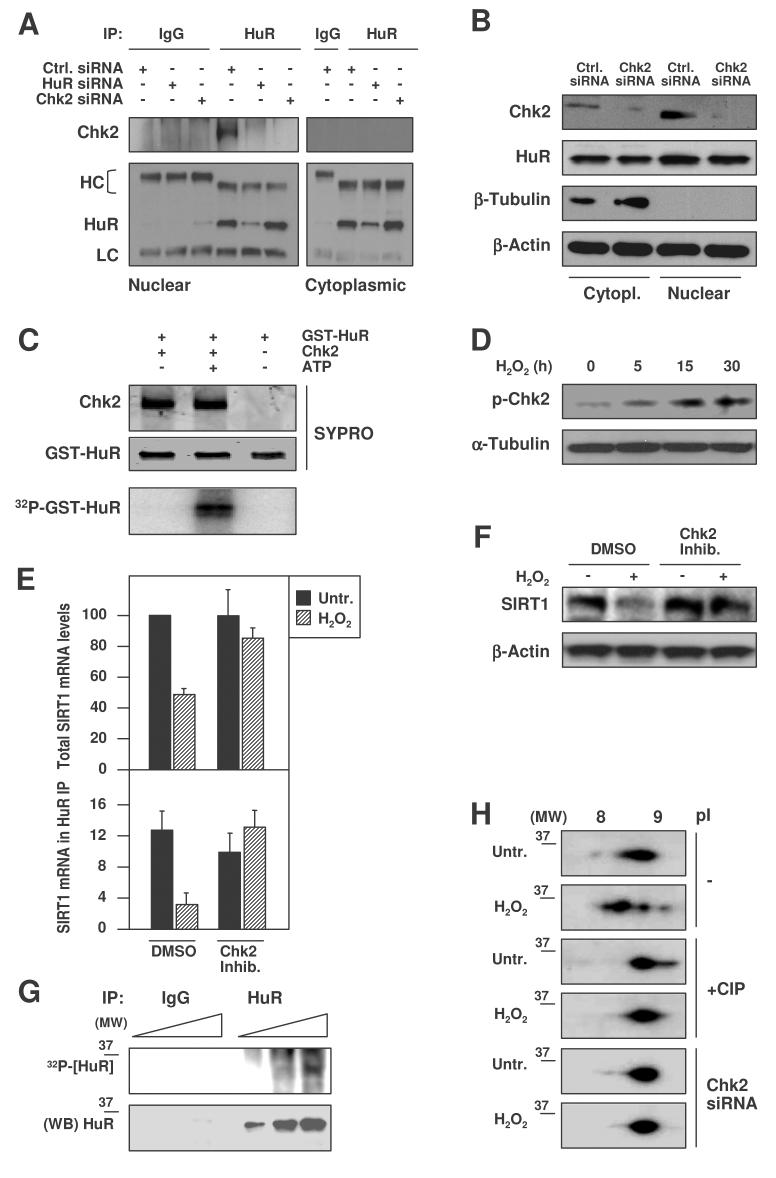
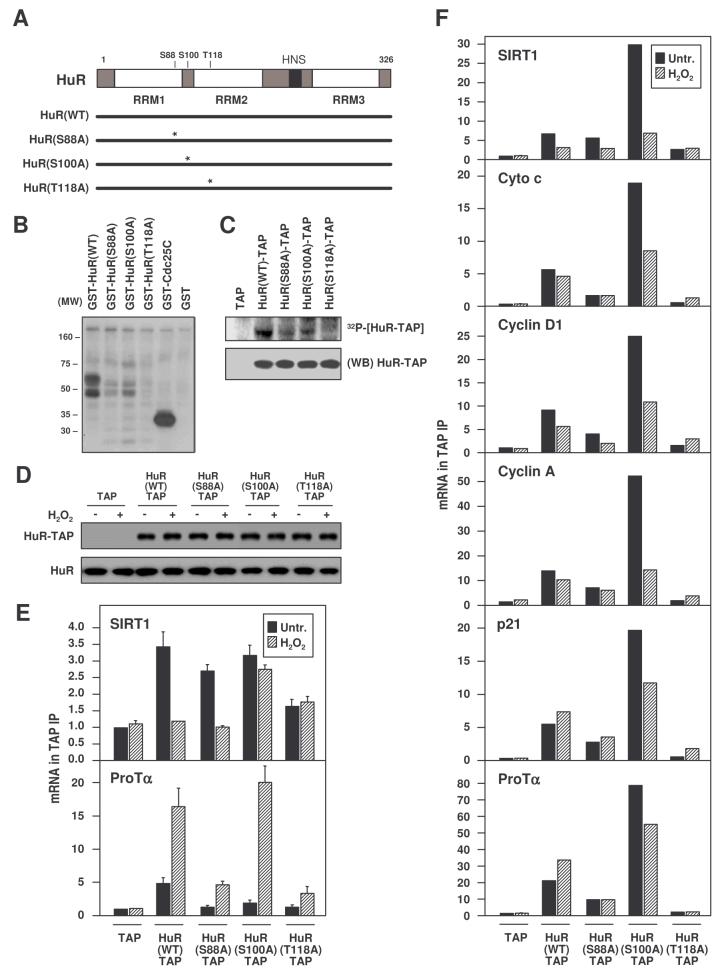
The RNA binding protein HuR regulates the stability of many target mRNAs. Here, we report that HuR associated with the 3' untranslated region of the mRNA encoding the longevity and stress-response protein SIRT1, stabilized the SIRT1 mRNA, and increased SIRT1 expression levels. Unexpectedly, oxidative stress triggered the dissociation of the [HuR-SIRT1 mRNA] complex, in turn promoting SIRT1 mRNA decay, reducing SIRT1 abundance, and lowering cell survival. The cell cycle checkpoint kinase Chk2 was activated by H(2)O(2), interacted with HuR, and was predicted to phosphorylate HuR at residues S88, S100, and T118. Mutation of these residues revealed a complex pattern of HuR binding, with S100 appearing to be important for [HuR-SIRT1 mRNA] dissociation after H(2)O(2). Our findings demonstrate that HuR regulates SIRT1 expression, underscore functional links between the two stress-response proteins, and implicate Chk2 in these processes.


Figures

Figure 1
Figure 1. HuR binds the SIRT1 mRNA
(A) SIRT1 mRNA showing HuR motif hits in the 3'UTR. (B) After IP of RNA-protein complexes from HeLa cell lysates using either anti-HuR antibodies or control IgG1, RNA was isolated and used in RT reactions. Graph, fold differences in transcript abundance in HuR IP compared with IgG IP, as measured by RT-qPCR analysis. Inset, representative qPCR products visualized in ethidium bromide-stained agarose gels; low-level amplification of UBC and GAPDH (housekeeping mRNAs which are not HuR targets) served as negative controls, while ProTα mRNA, a known HuR target, was used as a positive control. The means and standard error of the means (SEM) from 3 independent experiments are represented. (C) Schematic representation of the SIRT1 biotinylated transcripts (CR, 3′UTR) used in biotin pulldown assays; biotinylated GAPDH 3'UTR was included as a negative control. The presence of HuR, NF90, and TIA-1 in the pulldown material was assayed by Western blotting.
Figure 2
Figure 2. HuR silencing reduces SIRT1 expression in HeLa cells
(A) Two days after siRNA transfection, HeLa cells were harvested for Western blot analysis to monitor the expression of HuR, SIRT1, and loading control β-Actin. (B) Cells were transfected as explained in panel (A) and harvested, and RNA was analyzed by either Northern blotting (top), or RT-qPCR (bottom, shown as the means +SEM from 3 experiments). (C) Two days after transfection of an siRNA targetting the HuR 3'UTR (HuRU1) or a control siRNA, along with either TAP- or HuR-TAP-expressing vectors, the levels of endogenous (Endog.) or ectopic (HuR-TAP) HuR, SIRT1, and loading control β-Actin were tested by Western blot analysis. (D) Left, schematic of the mRNAs encoding the Sirt protein family members (SIRT1-7); middle, number of predicted HuR motif hits in each transcript; right, levels of SIRT1-7 mRNAs as determined by RT-qPCR following HuR silencing, compared with control siRNA. (E) SIRT1 mRNA half-life after silencing HuR was measured by incubating cells with actinomycin D, extracting total RNA at the times shown, and measuring SIRT1 and (housekeeping) GAPDH mRNA levels by RT-qPCR analysis. The data were normalized to 18S rRNA levels and represented as a percentage of the mRNA levels measured at time 0, before adding actinomycin D, using a semi-logarithmic scale. The half-lives (indicated) were calculated as the time required for each mRNA decrease to 50% of its initial abundance (discontinuous horizontal line). Inset, representative qPCR reaction products. (F) Northern blot analysis of the mRNAs described in panel D; rRNAs are shown.
Figure 3
Figure 3. Reduced SIRT1 levels in senescent or HuR-silenced HDFs
(A) SA-β-galactosidase activity in proliferating (Young or Y) and Senescent (S) WI-38 HDFs, at 28 and 52 population doublings, respectively. Graph, percentages of SA-β-galactosidase-positive cells. (B) Western blot analysis to monitor the expression of HuR and SIRT1 in Y and S HDFs. p53 and β-Actin levels were tested as positive and loading controls, respectively; p21 mRNA levels were measured by RT-qPCR (graph). HDFs were transfected with the siRNAs indicated and collected for analysis 5 d later. The effect of HuR silencing on HDF protein expression was assessed by Western blotting (C) and its influence on proliferation by measuring 3H-Thymidine incorporation (D). (E) Effect of HuR silencing on the levels of SIRT1-7 mRNAs in HDFs as determined by RT-qPCR in two separate experiments (mean values shown). (F) Half-lives of SIRT1 and GAPDH mRNAs in HDFs. Total RNA was extracted, SIRT1 and GAPDH mRNA levels monitored by RT-qPCR, normalized to 18S rRNA levels, and the half-lives calculated as described in the legend of Fig. 2E. Data represent the means ±SEM from 3 independent experiments.
Figure 4
Figure 4. H2O2 treatment decreased [HuR-SIRT1 mRNA] complexes and SIRT1 expression
(A) After treating HDFs with the indicated H2O2 doses, RNA was isolated and RT-qPCR performed; as a positive control, GADD153 mRNA levels were monitored. (B) Western blot analysis of SIRT1, HuR, and (loading control) α-Tubulin levels in HDF whole-cell lysates after treatment with H2O2 at the doses and times shown. (C)The half-lives of SIRT1 and GAPDH mRNAs in untreated and H2O2-treated HDFs were quantified by using RT-qPCR and calculated as described in the legend of Fig. 2E; the means ±SEM from 3 independent experiments. (D) IP with anti-HuR or IgG antibodies were performed using lysates that were prepared from either untreated or H2O2-treated HDFs (500 μM, 3 h); HuR abundance in the IP material was unchanged (not shown) and RNA was isolated for RT-qPCR analysis to detect SIRT1 mRNA, GAPDH mRNA (a housekeeping ‘background’ control), and ProTα mRNA (a positive control). Inset, representative qPCR products. (E) Percent SIRT1 mRNA (means and +SEM from 3 independent experiments) remaining in either whole-cell lysates (solid line) or HuR-bound material after RNP IP (dashed line) following H2O2 treatment (500 μM).
Figure 5
Figure 5. Protective influence of HuR and SIRT1 in H2O2-treated WI-38 cells
(A) Y and S cells were treated with the indicated H2O2 doses (left) and cells at the indicated pdls were treated with H2O2 (500 μM, 1 h, right) and survival was monitored 16 h later; data were obtained from two independent experiments. (B) Western blot analysis to monitor protein expression levels by 48 h after siRNA transfection. (C) Cells were transfected with the indicated siRNAs and plasmids [pZeo-HuR (pHuR) or vector control pZeo (V)]; 48 h later, cells were treated with H2O2 (500 μM, 1 h) and collected 16 h later for Western blot analysis. (D) Cell survival in cultures that were transfected and treated as described in panel C. (E) Western blot analysis of cells that were transfected and treated as described in panel C, except that the indicated siRNAs and plasmids [SIRT1 expression vector (pSIRT1) or vector control (V)] were used. (F) Cell survival in cultures that were transfected and treated as described in panel E. Transfection efficiencies were >90%; cell survival (A, D, F) was measured using the MTT assay.
Figure 6
Figure 6. Chk2 interacts with and phosphorylates HuR
(A) Nuclear and cytoplasmic IPs of HuR were performed after the indicated transfections, followed by HuR or CHK2 Western blot analysis. HC, heavy IgG chain; LC, light IgG chain. (B) Western blot analysis of HuR and Chk2 levels in either control (Ctrl.) or Chk2-silenced cultures; β-Tubulin was used as a cytoplasmic loading control and β-Actin as a loading control for total protein. (C) In vitro kinase assay using active Chk2 kinase and GST-HuR as substrate. The proteins used in the reaction were visualized by SYPRO staining; [γ-32P]ATP incorporation into GST-HuR served to monitor phosphorylation. (D) Western blot analysis of Chk2 phosphorylation at residue Thr-68 (p-Chk2) in WI-38 cells that were treated with 500 μM H2O2 for the times shown; α-Tubulin was tested as loading control. (E) After pretreatment of HDFs with a Chk2 inhibitor (1 μM, 1 h), then with 500 μM H2O2 for 3 h, RNA was isolated for RT-qPCR analysis of total (top) and HuR-bound (bottom) SIRT1 mRNA levels. Data are the means +SEM from 3 independent experiments. (F) Western blot analysis of SIRT1 expression in whole-cell lysates prepared from WI-38 cells that were pretreated with the Chk2 inhibitor (1 μM, 1 h) before treatment with 500 μM H2O2 for 6 h; β-Actin signals served to monitor loading. (G) Top, in vivo HuR phosphorylation, assessed by incubation of WI-38 cells with 32Pi for 16 h, followed by IP with either anti-HuR antibody or IgG (1, 5, and 10 μl of lysate were loaded). Bottom, Western blot analysis of HuR in the IP material. (MW), molecular weight marker. (H) 2-dimensional (2D) Western blot analysis of HuR in WI-38 cells treated with H2O2 (500 μM, 1 h). Before loading for separation in the first-dimension (pI), samples were either left without further treatment (−) or were pretreated with alkaline phosphatase (+CIP) for 1 h at 37°C; Chk2 siRNA, cells were transfected as described in panel B before treatment with H2O2.
Figure 7
Figure 7. Analysis of HuR carrying point mutations at Chk2 phosphorylation sites
(A) Schematic of point mutations introduced at the three predicted residues of phosphorylation by Chk2. In vitro phosphorylation assays were performed using recombinant purified Chk2 and either GST-HuR fusion proteins made in bacteria (B), or TAP-HuR fusion proteins made in HeLa cells (C). GST-Cdc25C, Chk2 substrate (positive control); (WB), Western blot analysis of HuR-TAP proteins. (D) Chimeric HuR-TAP proteins expressed in transfected WI-38 cells, then untreated or treated with H2O2 (500 μM, 3 h). Binding of chimeric HuR-TAP proteins to the indicated HuR target mRNAs was tested in transfected WI-38 cells (mean +SEM from 3 independent experiments) (E) and HeLa cells (mean of 2 independent experiments yielding similar results) (F) by performing TAP IP followed by RT-qPCR analysis.

Comment in

Similar articles

Cited by

References

    1. Astrom SU, Cline TW, Rine J. The Drosophila melanogaster sir2+ gene is nonessential and has only minor effects on position-effect variegation. Genetics. 2003;163:931–937. - PMC - PubMed
    1. Bartek J, Lukas J. Chk1 and Chk2 kinases in checkpoint control and cancer. Cancer Cell. 2003;3:421–429. - PubMed
    1. Bhattacharyya SN, Habermacher R, Martine U, Closs EI, Filipowicz W. Relief of microRNA-mediated translational repression in human cells subjected to stress. Cell. 2006;125:1111–1124. - PubMed
    1. Bevilacqua A, Ceriani MC, Capaccioli S, Nicolin A. Post-transcriptional regulation of gene expression by degradation of messenger RNAs. J. Cell Physiol. 2003;195:356–372. - PubMed
    1. Blander G, Guarente L. The Sir2 family of protein deacetylases. Annu. Rev. Biochem. 2004;73:417–435. - PubMed

Publication types

MeSH terms