. 2007;35(5):1737-49.
doi: 10.1093/nar/gkm073. Epub 2007 Feb 21.

Interactions of Kid-Kis toxin-antitoxin complexes with the parD operator-promoter region of plasmid R1 are piloted by the Kis antitoxin and tuned by the stoichiometry of Kid-Kis oligomers

Affiliations

Interactions of Kid-Kis toxin-antitoxin complexes with the parD operator-promoter region of plasmid R1 are piloted by the Kis antitoxin and tuned by the stoichiometry of Kid-Kis oligomers

Maria C Monti et al. Nucleic Acids Res. 2007.

Abstract

The parD operon of Escherichia coli plasmid R1 encodes a toxin-antitoxin system, which is involved in plasmid stabilization. The toxin Kid inhibits cell growth by RNA degradation and its action is neutralized by the formation of a tight complex with the antitoxin Kis. A fascinating but poorly understood aspect of the kid-kis system is its autoregulation at the transcriptional level. Using macromolecular (tandem) mass spectrometry and DNA binding assays, we here demonstrate that Kis pilots the interaction of the Kid-Kis complex in the parD regulatory region and that two discrete Kis-binding regions are present on parD. The data clearly show that only when the Kis concentration equals or exceeds the Kid concentration a strong cooperative effect exists between strong DNA binding and Kid2-Kis2-Kid2-Kis2 complex formation. We propose a model in which transcriptional repression of the parD operon is tuned by the relative molar ratio of the antitoxin and toxin proteins in solution. When the concentration of the toxin exceeds that of the antitoxin tight Kid2-Kis2-Kid2 complexes are formed, which only neutralize the lethal activity of Kid. Upon increasing the Kis concentration, (Kid2-Kis2)n complexes repress the kid-kis operon.


Figures

Figure 1.
Figure 1.
Effect of Kid on the interaction of Kis to parD DNA. Electrophoretic mobility shift assays were performed on the 5′-end-labelled 175-bp parD region I/II fragment (2 nM) and Kis and/or Kid. (A) Band-shift assays in the presence of a range of concentrations of Kis (0.075, 0.150, 0.300, 0.600, 1.2, 2.4, 4.8 and 9.6 µM) (lanes 2–9). Lane 10 presents control with only Kid (2.4 μM). (B) Band-shift assays over a range of Kis concentrations identical to the ones in (A) (lanes 3–10) and in the presence of a fixed concentration of Kid (2.4 µM). Lane 2 shows a control without Kid. Lane 1 presents the negative control without proteins. The specific complexes formed are indicated with c0, cI, cII and cIII.
Figure 2.
Figure 2.
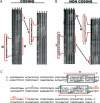
Kid–Kis and Kis interact at specific sites with parD DNA. Hydroxyl radical footprinting assays were performed on Kid–Kis mixtures (Kid–Kis ratio 1:2; Kid 2.4 and Kis 4.8 µM) and Kis (4.8 µM) alone on the 175-bp parD region I/II fragment. Protections in the coding (A) and non-coding (B) strands are indicated by black bars and dots. Lane 3 shows the protection pattern by Kis alone and lane 4 shows the protection pattern by the Kid–Kis complex. The sequences of the inverted repeats I and II that include the protected regions are indicated. Lanes 2 and 5 show the cleavage pattern of the DNA in the absence of any added protein. Lane 1 shows the Maxam–Gilbert AG ladder sequence. (C) Summary of the protected sites in parD region I/II by Kis and Kid–Kis complexes. The protected regions are indicated with numbers I and II. Region I contains an 18-bp perfect two-fold symmetry element (boxed) that includes the −10 motif. The site II includes an 18-bp pseudo-symmetric element that is also boxed. The dyad symmetry axis in each region is indicated with a broken line. Bases whose deoxyriboses are protected by Kis (thick bars) or Kid–Kis (thin bars) from cleavage by hydroxyl radical are indicated (underlined). DNA sequence of the −35 (underlined and labelled) and −10 elements of the promoter and the transcription initiation site are in blue. The ribosome-binding site (RBS) and translation initiation condon (Met) of kis are underlined and in red. The imperfect inverted repeats I and II are indicated with red arrows. The 30-bp DNA fragment used for mass spectrometry studies contains parD region I plus 2 bp upstream and 5 bp downstream.
Figure 3.
Figure 3.
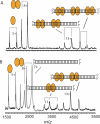
Dimers of Kis interact with parD region I. Macromolecular native mass spectrometry was performed on Kis-30-bp parD region I complexes in ammonium acetate (50 mM), pH 5.8. (A) Mass spectrum of the Kis:parD region I mixture at a molar ratio of 20:1 (Kis 7.5 μM). (B) Mass spectrum of Kis:parD region I mixture at a ratio of 5:1 (Kis 7.5 μM). Kis monomer and dimer are indicated with single and double orange ellipses, respectively, and the parD region I fragment with a double strand. Each complex is represented by an appropriate combination of ellipses and/or DNA double strand. Molecular masses and relative amounts of complexes are shown in Supplementary Tables 1 and 2, respectively.
Figure 4.
Figure 4.
Kis and Kid–Kis complexes interact tighter to parD region I than to the parD region II. (A and B) Summary of the protected sites in region I and II of parD by Kis and Kid–Kis complexes. The 18-bp symmetric element (region I) and the 18-bp pseudo-symmetric element (region II) are boxed, and the broken lines indicate the symmetry axis. The sequence of the −35 and the extended −10 motifs and the initiation transcription (+1) are underlined and in blue. (C and D) Electrophoretic mobility shift assays were performed on the 5′-end-labelled 115-bp parD region I fragment (2 nM) or on the 5′-end-labelled 81-bp parD region II fragment (2 nM) and Kis alone (2.4, 4.8 and 9.6 μM) (lanes 8–10) or a combination of Kid (2.4 µM) and Kis (0.3, 0.6, 1.2, 2.4, 4.8 and 9.6 μM) (lanes 2–7). Lane 1 presents the negative control without proteins. The specific complexes formed are indicated with cIV, cV, cVI and cVII.
Figure 5.
Figure 5.
Kid–Kis complexes (molar ratio of 2:1) interact with parD region I. Macromolecular native mass spectrometry was performed on Kid–Kis and on Kid–Kis–parD DNA complexes in ammonium acetate (50 mM), pH 5.8. (A) Mass spectrum of a mixture of Kid:Kis at a molar ratio of 2:1 (Kis 7.5 μM) and (B) and (C) mass spectra of mixtures of Kid:Kis:parD DNA mixtures at molar ratios of 80:40:1 and 20:10:1 (Kis 7.5 μM), respectively. Kid and Kis are indicated with blue rectangles and orange ellipses, respectively, and the parD DNA fragment with double strand. Each complex is represented by an appropriate combination of rectangles, ellipses and/or DNA double strand. Molecular masses and relative amounts of complexes are shown in Supplementary Tables 1 and 2, respectively.
Figure 6.
Figure 6.
Kid–Kis complexes (molar ratio of 1:1) interact tightly with parD region I. Macromolecular native mass spectrometry was performed on Kid–Kis and on Kid–Kis–parD DNA complexes in ammonium acetate (50 mM), pH 5.8. (A) Mass spectrum of a mixture of Kid:Kis at a molar ratio of 1:1 (Kis 15 μM) and (B) and (C) mass spectra of Kid:Kis:parD DNA mixtures at molar ratios of 40:40:1 and 10:10:1 (Kis 15 μM), respectively. Kid and Kis are indicated with blue rectangles and orange ellipses, respectively, and the parD DNA fragment with double strand. Each complex is represented by an appropriate combination of rectangles, ellipses and/or DNA double strand. Molecular masses and relative amounts of complexes are shown in Supplementary Tables 1 and 2, respectively.
Figure 7.
Figure 7.
Macromolecular tandem mass spectrometry reveals topology of Kid–Kis–parD DNA region I complexes. Tandem mass spectrometry was performed on Kid–Kis and Kid–Kis–parD DNA in ammonium acetate (50 mM), pH 5.8. (A) Tandem mass spectra of Kis2–Kid2–Kid2–Kis2 after selection of the 20+ ion and (B) tandem mass spectra of Kis2–Kid2–Kid2–Kis2parD DNA complex after selection of the 21+ ion. Acceleration voltages varied between 25 and 65 V. Kid and Kis are indicated with blue rectangles and orange ellipses, respectively and the parD DNA fragment with double strand. Each complex is represented by an appropriate combination of rectangles, ellipses and/or DNA double strand.
Figure 8.
Figure 8.
Schematic model of the transcription autoregulation of the parD operon. The kid gene and the Kid protein are shown in blue and the kis gene and the Kis protein in orange. Each protein complex is represented by an appropriate combination of blue rectangles (Kid) and orange ellipses (Kis). Free Kid inhibits cell growth. In conditions in which the concentration of Kid is higher than that of Kis Kid2–Kis1 and Kid2–Kis2–Kid2 complexes are formed. These complexes repress ribonuclease activity of Kid, but allow efficient transcription. When the concentration of Kid is equal or lower than that of Kis, mostly 1:1 complexes are formed. These complexes do not only repress the ribonuclease activity of Kid, but also the transcription process.

Similar articles

Cited by

References

    1. Anantharaman V, Aravind L. New connections in the prokaryotic toxin-antitoxin network: relationship with the eukaryotic nonsense-mediated RNA decay system. Genome Biol. 2003;4:81. - PMC - PubMed
    1. Hayes F. Toxins-antitoxins: plasmid maintenance, programmed cell death, and cell cycle arrest. Science. 2003;301:1496–1499. - PubMed
    1. Gerdes K, Christensen SK, Lobner-Olesen A. Prokaryotic toxin-antitoxin stress response loci. Nat. Rev. Microbiol. 2005;3:371–382. - PubMed
    1. Bernard P, Couturier M. Cell killing by the F-plasmid Ccdb protein involves poisoning of DNA-topoisomerase-Ii complexes. J. Mol. Biol. 1992;226:735–745. - PubMed
    1. Jiang Y, Pogliano J, Helinski DR, Konieczny I. ParE toxin encoded by the broad-host-range plasmid RK2 is an inhibitor of Escherichia coli gyrase. Mol. Microbiol. 2002;44:971–979. - PubMed

Publication types