. 2007 May 15;581(Pt 1):75-90.
doi: 10.1113/jphysiol.2006.127472. Epub 2007 Feb 22.

The role of synaptotagmin I C2A calcium-binding domain in synaptic vesicle clustering during synapse formation

Affiliations

The role of synaptotagmin I C2A calcium-binding domain in synaptic vesicle clustering during synapse formation

Peter Gardzinski et al. J Physiol. .

Abstract

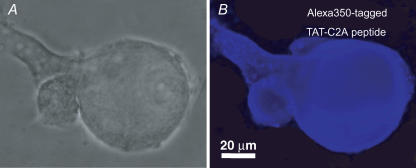
Synaptic vesicles aggregate at the presynaptic terminal during synapse formation via mechanisms that are poorly understood. Here we have investigated the role of the putative calcium sensor synaptotagmin I in vesicle aggregation during the formation of soma-soma synapses between identified partner cells using a simple in vitro synapse model in the mollusc Lymnaea stagnalis. Immunocytochemistry, optical imaging and electrophysiological recording techniques were used to monitor synapse formation and vesicle localization. Within 6 h, contact between appropriate synaptic partner cells up-regulated global synaptotagmin I expression, and induced a localized aggregation of synaptotagmin I at the contact site. Cell contacts between non-synaptic partner cells did not affect synaptotagmin I expression. Application of an human immunodeficiency virus type-1 transactivator (HIV-1 TAT)-tagged peptide corresponding to loop 3 of the synaptotagmin I C2A domain prevented synaptic vesicle aggregation and synapse formation. By contrast, a TAT-tagged peptide containing the calcium-binding motif of the C2B domain did not affect synaptic vesicle aggregation or synapse formation. Calcium imaging with Fura-2 demonstrated that TAT-C2 peptides did not alter either basal or evoked intracellular calcium levels. These results demonstrate that contact with an appropriate target cell is necessary to initiate synaptic vesicle aggregation during nascent synapse formation and that the initial aggregation of synaptic vesicles is dependent on loop 3 of the C2A domain of synaptotagmin I.


Figures

Figure 1
Figure 1. Mammalian anti-syt I antibodies specifically detectL. stagnalissyt I
Alignment of known protein sequences for synaptotagmin I from various species. The C2A and C2B regions are marked by a solid black and grey bar, respectively; the loop 3 within the Ca2+-binding regions of the C2A and C2B are represented by short lines.
Figure 2
Figure 2. Presynaptic Ca2+ hotspots and syt I clustering at the contact site between functional synaptic partners
A, representative intracellular recordings (Ab) of soma–soma paired presynaptic and postsynaptic neurons (Aa, transmitted light imaging) after 12 h in culture. Electrical stimulation (bar) of RPeD1 (presynaptic cell) evoked excitatory postsynaptic potentials (EPSP) in VD2 (postsynaptic cell). B, simultaneous fura-2 signal from the same synaptic paired neurons shown in A, detected before (resting), during (stimulation) and after stimulation (recovery) with an action potential train in the presynaptic cell. C, Western blot analysis for syt I and β-actin in rat and snail brain preparations. The anti-syt I antibody detected a single band running at 65 kDa in both preparations, and the anti-β-actin antibody (the control) detected a single band at 43 kDa. Da, syt I immunofluorescence imaging of the same cell pair as in A and B. The fluorescence signal intensity detected was higher at the postsynaptic cell contact site in the presynaptic cell, as indicated by arrows, than in other regions of the cells. Db, a schematic diagram illustrates the regions (coloured) where the measurement was taken from a cell pair. (A, green, presynaptic contact site; B, blue, presynaptic non-contact site; C, red, postsynaptic contact site; D, orange, postsynaptic non-contact site.). Transmitted light imaging (Ea) and syt I immunofluorescence imaging (Eb) of a representative single L. stagnalis neuron. F, a negative control cell pair labelled using only secondary antibodies (Fa, transmitted light; Fb: fluorescence imaging). G, summary of the syt I levels from paired and un-paired individual cells under the same conditions. Pre-contact, the cell contact site of the presynaptic cells; Pre-non-contact, the regions of the presynaptic cells free of cell-contact; Post-contact, the cell contact site of the postsynaptic cells; Post-non-contact, the regions of the postsynaptic cells free of cell-contact; single, the non-paired individual cells. Syt I levels are indicated by the mean amplitude fluorescence intensity in arbitrary units (AU). The data are presented as mean values ± s.e.m. and the numbers indicate the sample size. *Statistically significant relative to the regions in the postsynaptic contacted cells, or non-contacted individual cells (P < 0.05); #statistically significant difference between the regions within the same cells (P < 0.05).
Figure 3
Figure 3. Time-dependent alteration of syt I expression in presynaptic neurons following target cell contact
Representative examples of syt I immunofluorescence signal in identified L. stagnalis synaptic cell partners at 1 (Aa), 3 (Ba), and 6 (Ca) h after cell contact in culture. Inset, transmitted light imaging of the corresponding cells. Ab, Bb and Cb, summary of the syt I immunofluorescence signals in different regions of the presynaptic and postsynaptic partner cells and the non-paired individual cells at indicated time. Pre-contact, the cell contact site of the presynaptic cells; Pre-non-contact, the regions of the presynaptic cells free of cell-contact; Post-contact, the cell contact site of the postsynaptic cells; Post-non-contact, the regions of the postsynaptic cells free of cell-contact; single, the non-paired individual cells. Syt I levels are indicated by the mean amplitude fluorescence intensity of the signal in arbitrary units (AU). The data are presented as mean values ± s.e.m.; numbers indicate the sample size. *Statistically significant difference relative to the regions in the postsynaptic contacted cells, or non-contacted individual cells (P < 0.05); #statistically significant difference between the regions within the same cells (P < 0.05).
Figure 4
Figure 4. Lack of syt I clustering in non-synaptic cell pairs
Representative examples of Syt I fluorescence images in RPeD1 (cell 2) and PeA (cell 1) cell pair, which do not form synapses in vivo or in vitro, at 3 (Aa) and 12 h (Ba) after the cells made contact in culture. X2: Summary of the syt I immunofluorescence signals in different regions of the presynaptic and postsynaptic partner cells and the non-paired individual cells at the indicated times. Cell 1 contact, the cell contact site of RPeD1 cells; Cell1 non-contact, the regions free of cell contact of the presynaptic cells; Cell2 contact, the cell contact site in PeA cells; Cell2 non-contact, the regions free of cell contact in PeA cells; single, the non-paired individual cells. Syt I levels are indicated by the mean amplitude fluorescence intensity of the signal in arbitrary units (AU). The data are presented as mean values ± s.e.m. and the numbers indicate the sample size.
Figure 5
Figure 5. The HIV-1 TAT syt I peptides enter neurons
Representative transmitted light (A) and fluorescence confocal (B) imaging of neurons treated with Alexa350 fluorophore conjugated HIV-1 TAT–C2A Ca2+-binding motif peptide. The fluorescence imaging reflects the mid-section of the cells.
Figure 6
Figure 6. The TAT–C2A loop 3 peptide specifically blocks clustering of syt I and prevents formation of functional synapses
Aa and Ba, representative intracellular recordings for paired synaptic partner cells, VD4 (presynaptic cell) and LPeD1 (postsynaptic cell); Ab and Bb, representative anti-syt I immunocytochemical fluorescent imaging of paired synaptic partner cells; Ac and Bc, summary of syt I signal intensities in the paired and individual non-paired cells. A, a 6 h treatment with TAT–C2A peptide resulted in a lack of functional synaptic connections (Aa) and prevented presynaptic syt I aggregation (Ab). Electrical stimulation of both the pre- and postsynaptic cells evoked action potential trains (Aa), indicating that both cells are healthy. Ac, syt I signal intensities in presyantpic cells were comparable to those in postsynaptic cells or individual cells after the 6 h TAT–C2A peptide treatment (n = 6). Treatments employing either control (B) or mutant (C) TAT–C2A peptide did not affect synapse formation. Representative intracellular recordings of paired cells (Ba and Ca) show synaptic connections between synaptic partners; syt I immunofluorescence signals (Bb and Cb) show presynaptic syt I aggregation after treatment with the control peptides for 6 h. Summary of syt I signals for control (Bc) or mutant (Cc) C2A peptide treatments. *Statistically significant difference relative to the regions in the postsynaptic contacted cells, or non-contacted individual cells (P < 0.05). #Statistically significant difference between the regions within the same cells (P < 0.05).
Figure 7
Figure 7. TAT–C2B Ca2+-binding motif peptide did not affect syt I clustering during synapse formation, but inhibited synaptic transmission in mature synapses
A, chronic application of TAT–C2B peptide did not prevent SV clustering during synapse formation between VD4 (presynaptic cells) and LPeD1 (postsynaptic cells). A representative intracellular recording (Aa) of paired cells shows that the presynaptic stimulation evoked EPSP in LPeD1 cell, and fluorescence image (Ab) reveals intense syt I immunofluorescence signals at the cell contact site in VD4, after the cell pair was treated with TAT–C2B peptide for 6 h. Ac, summary of syt I signal intensities after treatment with TAT–C2B peptide for 6 h, from different regions of the presynaptic and postsynaptic partner cells and the non-paired individual cells as indicated. B, acute application of C2B peptide inhibited synaptic transmission in mature synapses. Bb, representative paired intracellular recording of presynaptic and postsynaptic neurons paired for 12 h recorded before (0 min) and after TAT–C2B peptide application (0.5 μm) for 15 or 25 min. The presynaptic cell fired spontaneously while postsynaptic membrane potential was monitored via a fast perfusion system. The TAT–C2B peptide reduced synaptic transmission of postsynaptic potentials in a time-dependent manner while presynaptic excitability was unaffected. Bb, summary of TAT–C2B peptide-induced time-dependent inhibition of synaptic transmission (n = 4). Postsynaptic potential amplitudes were averaged at time points (0, 15, 25 min) after application of TAT–C2B peptide. A 77% reduction in EPSP amplitude was observed at 25 min after peptide application. C, acute application of C2A peptide (0.5 μm) did not affect synaptic transmission in mature synapse. The experiments were conducted under the same condition as in B. Ca, representative paired intracellular recording of presynaptic and postsynaptic neurons. Cb, summary of TAT–C2A peptide effect on the EPSPs recorded from four independent synapses. The difference between EPSPs recorded before and after peptide application was not statistically significant (P > 0.05). *Statistically significant difference relative to the regions in the postsynaptic contacted cells, or non-contacted individual cells (P < 0.05); #statistically significant difference between the regions within the same cells (P < 0.05); **statistically significant difference between the control and treated conditions.
Figure 8
Figure 8. TAT–C2A peptide did not alter Ca2+ levels in individual neurons
A, representative fura-2 imaging (upper panel) recorded from an isolated cell before (resting), during (stimulation) and after stimulation (recovery) with a 3 Hz action potential train (lower panel), prior to and following TAT–C2A peptide treatment (indicated by the solid grey bar). Scale bar, 40 mm. B, summary of the basal and evoked fura-2 signal. TAT–C2A peptides did not significantly affect either the basal Ca2+ levels or the evoked Ca2+ levels induced by the same stimulation protocol (n = 4, P > 0.05). *The evoked signals were significantly larger than the basal level (P < 0.05).

Similar articles

Cited by

References

    1. Ahmari SE, Buchanan J, Smith SJ. Assembly of presynaptic active zones from cytoplasmic transport packets. Nat Neurosci. 2000;3:445–451. - PubMed
    1. Antz C, Geyer M, Fakler B, Schott MK, Guy HR, Frank R, Ruppersberg JP, Kalbitzer HR. NMR structure of inactivation gates from mammalian voltage-dependent potassium channels. Nature. 1997;385:272–275. - PubMed
    1. Atwood HL, Karunanithi S. Diversification of synaptic strength: presynaptic elements. Nat Rev Neurosci. 2002;3:497–516. - PubMed
    1. Augustine GJ. How does calcium trigger neurotransmitter release? Curr Opin Neurobiol. 2001;11:320–326. - PubMed
    1. Bai J, Wang P, Chapman ER. C2A activates a cryptic Ca2+-triggered membrane penetration activity within the C2B domain of synaptotagmin I. Proc Natl Acad Sci U S A. 2002;99:1665–1670. - PMC - PubMed

Publication types

MeSH terms

LinkOut - more resources