. 2007 May 15;581(Pt 1):139-54.
doi: 10.1113/jphysiol.2006.124321. Epub 2007 Feb 22.

Layer- and cell-type-specific suprathreshold stimulus representation in rat primary somatosensory cortex

Affiliations

Layer- and cell-type-specific suprathreshold stimulus representation in rat primary somatosensory cortex

C P J de Kock et al. J Physiol. .

Abstract

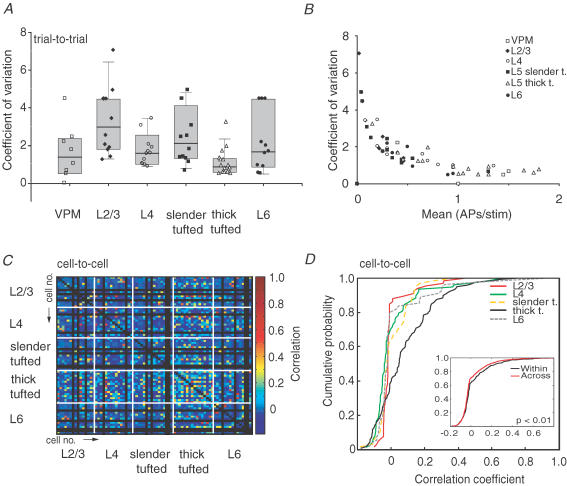
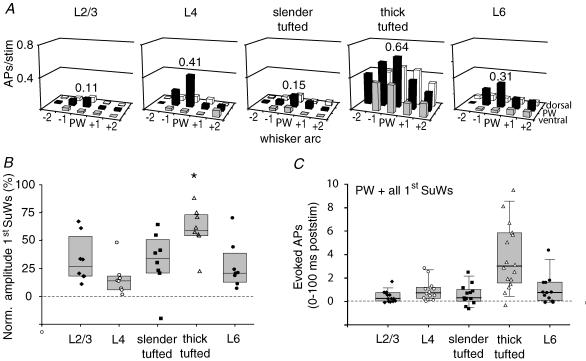
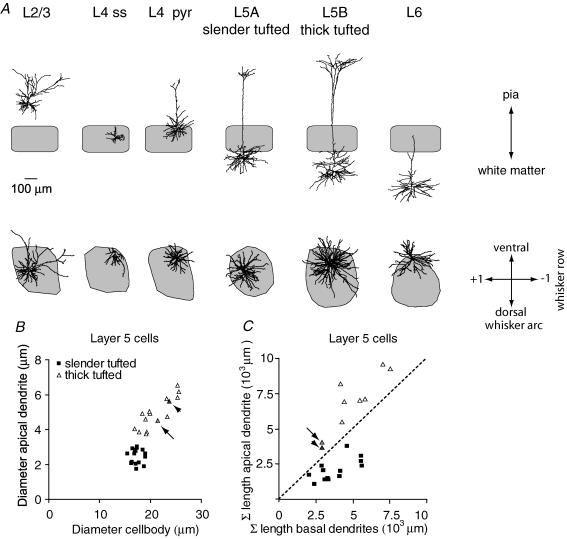
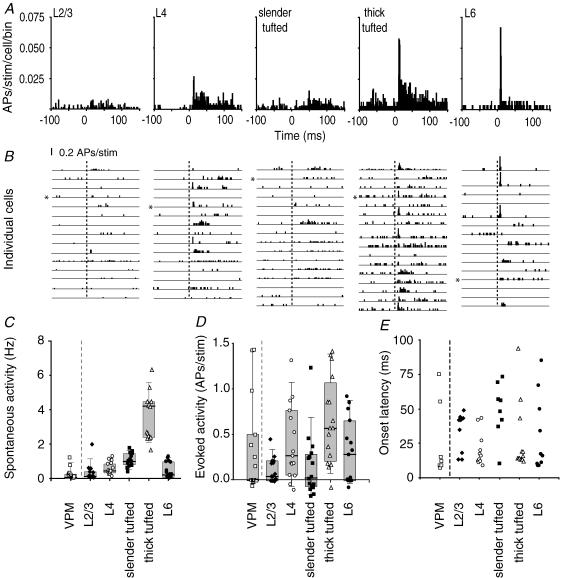
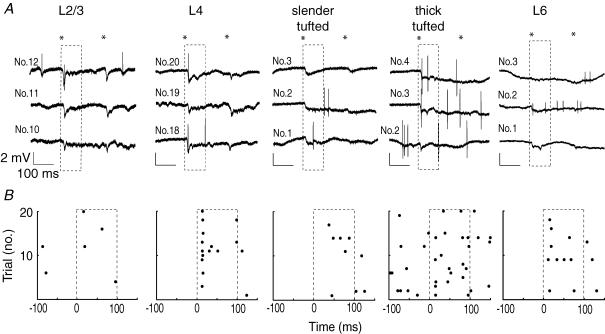
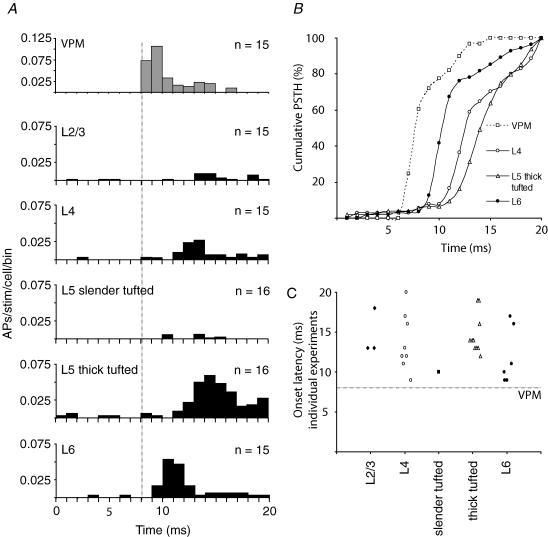
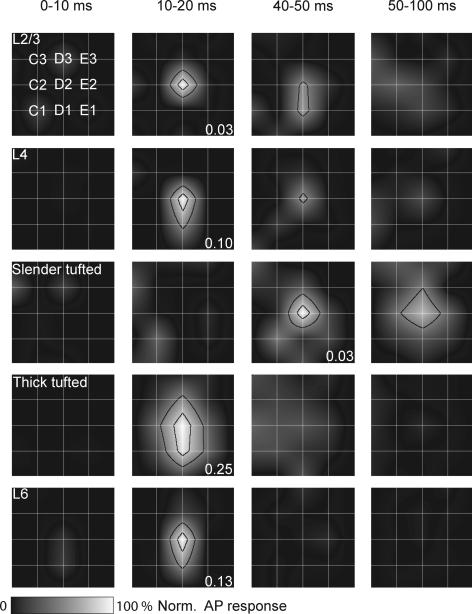
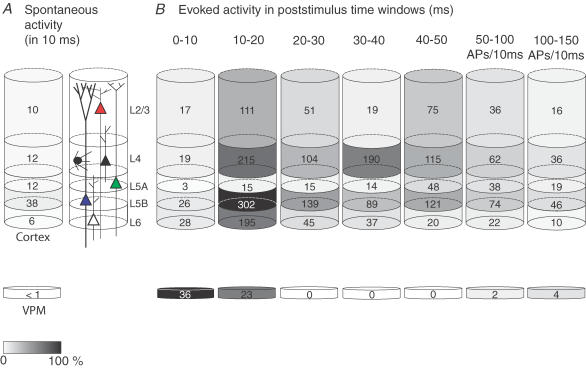
Sensory stimuli are encoded differently across cortical layers and it is unknown how response characteristics relate to the morphological identity of responding cells. We therefore juxtasomally recorded action potential (AP) patterns from excitatory cells in layer (L) 2/3, L4, L5 and L6 of rat barrel cortex in response to a standard stimulus (e.g. repeated deflection of single whiskers in the caudal direction). Subsequent single-cell filling with biocytin allowed for post hoc identification of recorded cells. We report three major conclusions. First, sensory-evoked responses were layer- and cell-type-specific but always < 1 AP per stimulus, indicating low AP rates for the entire cortical column. Second, response latencies from L4, L5B and L6 were comparable and thus a whisker deflection is initially represented simultaneously in these layers. Finally, L5 thick-tufted cells dominated the cortical AP output following sensory stimulation, suggesting that these cells could direct sensory guided behaviours.


Figures

Figure 5
Figure 5. Laminar comparison of AP response variability
A, distribution of trial-to-trial response consistency for individual experiments. Higher values indicate higher variability of principal whisker-evoked responses. B, coefficient of variation as a function of mean response amplitude across cell types. C, correlation of evoked responses (e.g. PSTHs) between cells. The x- and y-axes both represent individual experiments. Each pixel corresponds to the correlation value between evoked response patterns during the 0–100 ms post-stimulus time. The correlation coefficient is colour coded. Note that highest correlation values are obtained when comparing L5 thick-tufted cells with other L5 thick-tufted cells, indicating that cell-to-cell variability is lowest. D, correlation values from C were plotted in a cumulative histogram for all cell types. Note that L5 thick-tufted cells have the highest correlation values. Inset shows cumulative histogram for correlation values from comparison within each cell type (black line) or across cell types (red line). Correlation values for within comparison were significantly higher compared with correlation values across (Mann–Whitney U test, P < 0.01), indicating that within cell types, variability is lower compared with variability between cell types.
Figure 7
Figure 7. The output of a cortical column is dominated by L5 thick-tufted cells
A, receptive fields (RFs) for the different cell types illustrate evoked AP activity after deflection of principal and surround whiskers in the 0–100 ms post-stimulus period, centred on their principal whisker according to the anatomical location (63 D2, 2 D1, 10 D3 and 2 D4 cells). B, responses of surround whiskers were normalized to principal whisker response for each layer. Note that the RF of L5 thick-tufted cells is significantly broader than the RF of all other cell types. C, total number of evoked APs summed for the principal whisker and all first order surround whiskers in the 0–100 ms post-stimulus time window. Only experiments in which all 8 surround whiskers were measured were included.
Figure 1
Figure 1. Classification of barrel-related cells
A, reconstructions of representative examples in coronal (top) and tangential view (bottom). The grey shape shows the contour of the D2 column, representing the cytochrome oxidase dense area in L4. B, diameter of apical dendrites of L5 cells compared with cell body diameter suggests two populations of L5 cells (slender-tufted, average diameter of soma 17.4 ± 1.0 μm and diameter of apical dendrite 2.5 ± 0.4 μm; thick-tufted, diameter of soma 21.1 ± 3.0 μm and diameter of apical dendrite 4.9 ± 0.9 μm). C, for thick-tufted cells, the total length (Σ) of the apical dendrite (apical tuft and oblique dendrites) always exceeds the total length of the basal dendrites. In L5 slender-tufted cells, this relationship is reversed. Note that L5 cells may have intermediate values (arrow and arrowhead). These cells were categorized as thick-tufted cells, based on diameter of the apical dendrite and appearance of apical tuft.
Figure 3
Figure 3. Layer- and cell-type-specific AP responses after principal whisker deflection
A, average peristimulus time histograms (PSTHs) to illustrate the response in time after deflection of the principal whisker (1 ms bins, n = 15 cells for L2/3, L4 and L6; n = 16 for both L5 slender- and thick-tufted cells). B, individual PSTHs for all experiments from different cell types. Asterisks indicate experiments shown in Fig. 2. Dashed lines indicate onset of principal whisker stimulation. C, spontaneous activity for different cell types. Recordings were also made from the ventroposterior medial nucleus of the thalamus (VPM, n = 15, 0.21 ± 0.33 Hz). D, number of evoked APs after a whisker deflection (0–100 ms after stimulus, after subtraction of spontaneous activity). Negative values indicate evoked AP responses below spontaneous values. Evoked activity in VPM was 0.35 ± 0.53 APs per stimulus. E, onset latency for individual experiments that showed an evoked response.
Figure 2
Figure 2. Cortical APs in response to principal whisker deflection
A, 3 consecutive (unfiltered) single trial examples of juxtasomal recordings in different layers of the D2 column of barrel cortex. The asterisks illustrate the onset and offset of whisker movement, whereas the dashed box represents the first 100 ms after stimulus onset used to quantify evoked APs. B, raster plots showing all trials for single example cells shown in A. Note that AP responses are layer-specific and that the slender-tufted cell has the longest latency to spiking.
Figure 4
Figure 4. Near-simultaneous stimulus representation in multiple cell types
A, average PSTHs illustrating the response in time after deflection of the principal whisker. Note that the upper panel represents data from VPM recordings. Data from cortical recordings are analogous to Fig. 3A but at higher time resolution (only 0–20 ms post-stimulus time window is shown). The vertical line indicates the onset of VPM activity at 8.1 ms post-stimulus (Brecht & Sakmann, 2002a). B, cumulative distribution of APs occurring within the first 20 ms after the onset of the principal whisker deflection (data from A). The steepest part of the curves indicates the time window when the majority of the APs occurred within the first 20 ms. The x-axis is the time in milliseconds relative to the onset of the principal whisker deflection; y-axis is the proportion of APs up to the corresponding time point after the stimulus (e.g. 100% at 20 ms). Distribution and amplitude of AP responses were significantly different for L4, L5 thick-tufted cells and L6 cells (Kolmogorov–Smirnov test, P < 0.01 for all comparisons). C, onset latency for individual experiments that showed an evoked response. Data are analogous to Fig. 3E but only the 0–20 ms onset latency values are shown.
Figure 6
Figure 6. Layer-specific dynamics of suprathreshold RF structure
The grid of white lines indicates the barrel field, with the intersection representing the centre of the barrel with the principal whisker aligned in the middle. Surround whisker responses were normalized to the principal whisker response. The black lines delineate the areas equal to 80 (inner contour) and 50% (outer contour) of the maximal principal whisker response. Responses were normalized to the peak response within each layer. The numbers indicate average evoked response (APs per cell per stimulus) for the time window in which maximal firing was observed.
Figure 8
Figure 8. Schematic representation of APs emitted across different layers in barrel cortex column after PW deflection
Number of APs per cell was multiplied by the number of cells present in the column (see Results) to calculate the total number of APs generated by each layer. Values are represented in grey values and normalized to peak activity (maximum number of APs per layer and time frame; here L5 thick-tufted cells at 10–20 ms). A, spontaneous APs. B, evoked APs. Note that the bulk of evoked APs is in the 10–20 ms window post-stimulus and that most APs are generated by L5 thick-tufted cells.

Comment in

Similar articles

Cited by

References

    1. Agmon A, Connors BW. Correlation between intrinsic firing patterns and thalamocortical synaptic responses of neurons in mouse barrel cortex. J Neurosci. 1992;12:319–329. - PMC - PubMed
    1. Agmon A, Yang LT, O'Dowd DK, Jones EG. Organized growth of thalamocortical axons from the deep tier of terminations into layer IV of developing mouse barrel cortex. J Neurosci. 1993;13:5365–5382. - PMC - PubMed
    1. Ahissar E, Sosnik R, Bagdasarian K, Haidarliu S. Temporal frequency of whisker movement. II. Laminar organization of cortical representations. J Neurophysiol. 2001;86:354–367. - PubMed
    1. Ahissar E, Sosnik R, Haidarliu S. Transformation from temporal to rate coding in a somatosensory thalamocortical pathway. Nature. 2000;406:302–306. - PubMed
    1. Alloway KD, Crist J, Mutic JJ, Roy SA. Corticostriatal projections from rat barrel cortex have an anisotropic organization that correlates with vibrissal whisking behavior. J Neurosci. 1999;19:10908–10922. - PMC - PubMed

Publication types

LinkOut - more resources