. 2007 Jun 15;109(12):5463-72.
doi: 10.1182/blood-2006-11-059071. Epub 2007 Feb 22.

Beta-catenin stabilization stalls the transition from double-positive to single-positive stage and predisposes thymocytes to malignant transformation

Affiliations

Beta-catenin stabilization stalls the transition from double-positive to single-positive stage and predisposes thymocytes to malignant transformation

Zhuyan Guo et al. Blood. .

Abstract

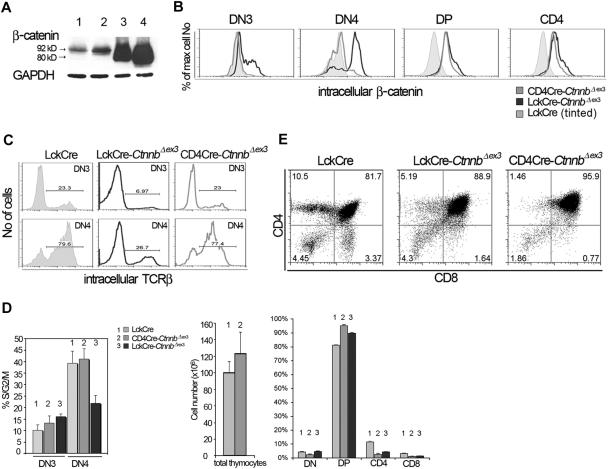
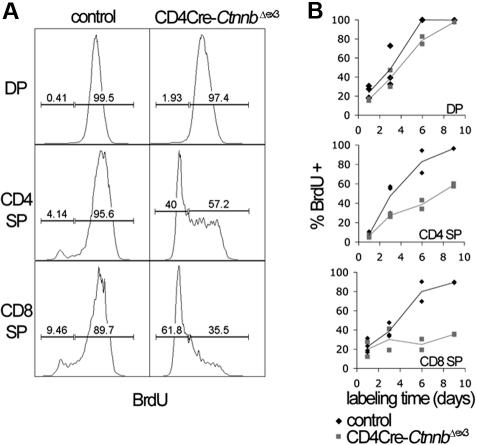
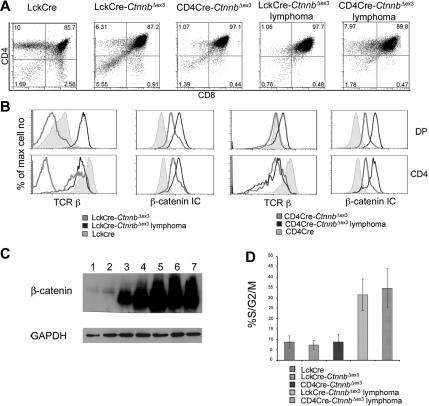
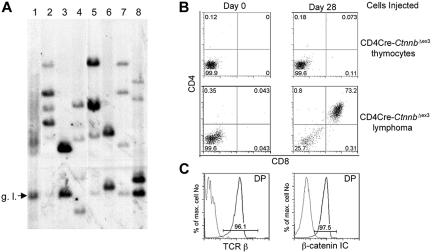
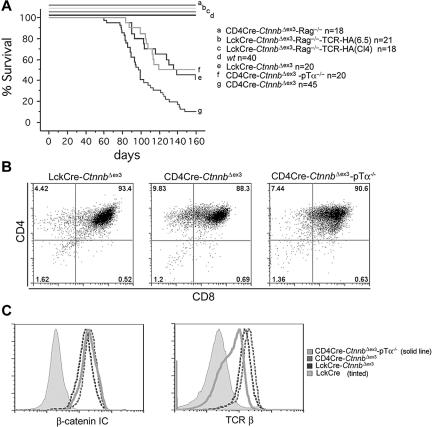
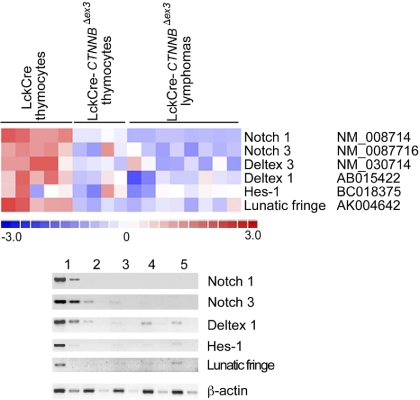
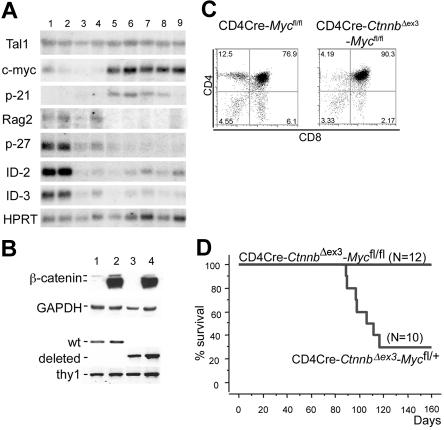
Activation of beta-catenin has been causatively linked to the etiology of colon cancer. Conditional stabilization of this molecule in pro-T cells promotes thymocyte development without the requirement for pre-TCR signaling. We show here that activated beta-catenin stalls the developmental transition from the double-positive (DP) to the single-positive (SP) thymocyte stage and predisposes DP thymocytes to transformation. beta-Catenin-induced thymic lymphomas have a leukemic arrest at the early DP stage. Lymphomagenesis requires Rag activity, which peaks at this developmental stage, as well as additional secondary genetic events. A consistent secondary event is the transcriptional up-regulation of c-Myc, whose activity is required for transformation because its conditional ablation abrogates lymphomagenesis. In contrast, the expression of Notch receptors as well as targets is reduced in DP thymocytes with stabilized beta-catenin and remains low in the lymphomas, indicating that Notch activation is not required or selected for in beta-catenin-induced lymphomas. Thus, beta-catenin activation may provide a mechanism for the induction of T-cell-acute lymphoblastic leukemia (T-ALL) that does not depend on Notch activation.


Figures

Figure 1
Figure 1
Thymocyte development in CD4Cre-CtnnbΔex3 versus LckCre-CtnnbΔex3 mice. (A) β-Catenin protein levels in total thymocyte extracts from LckCre control (lanes 1-2), LckCre-CtnnbΔex3 (lane 3), and CD4Cre-CtnnbΔex3 (lane 4) mice revealed by Western blot analysis. Arrows depict wild-type and mutated β-catenin. Numbers indicate the predicted molecular weight in kilodaltons. (B) Course of β-catenin stabilization during thymocyte development. Thymocytes from the indicated mice were surface stained for expression of CD4 and CD8, or with a cocktail of lineage-specific antibodies (“Materials and methods”) combined with staining for surface expression of CD44 and CD25. Cells were then permeabilized and stained with anti–β-catenin FITC. Histogram overlays of electronically gated cells in the indicated subsets are representative of 4 independent experiments. (C) Intracellular TCRβ expression of DN3- and DN4-stage thymocytes. Thymocytes from the indicated mouse strains were surface stained as in panel B prior to permeabilization and staining for intracellular TCRβ expression (TCRβ-PE). Histograms depict intracellular TCRβ expression in the indicated electronically gated subsets. Numbers in the histograms indicate the fraction of TCRβ-positive cells and are representative of 5 independent experiments. (D) Fraction of DN3- and DN4-stage thymocytes in S/G2/M phases of the cell cycle. Thymocytes were surface stained as in panel B prior to permeabilization and intracellular staining with the DNA binding dye 7AAD to estimate their DNA content. Histogram bars represent the average values of 5 independent experiments; error bars represent standard deviation. (E, upper panels) CD4/CD8 profiles of thymocytes from the indicated mouse strains; the numbers in the quadrants indicate the percentage of cells in each. Profiles are representative of 6 independent experiments. (E, lower panels) Thymic cellularity was estimated in 4- to 8-week-old mice. Percent distribution of the different thymocyte subsets was determined after surface staining for CD4 and CD8. Data represent average values from 6 LckCre, 6 CD4Cre-CtnnbΔex3, and 5 LckCre-CtnnbΔex3. Standard errors are included. While LckCre-CtnnbΔex3 thymi have reduced cellularity,, the cellularity of CD4Cre-CtnnbΔex3 thymi (P = .455) and the number of DPs (P = .2348) were comparable to LckCre controls in contrast to the absolute number of SPs, which was reduced in CD4Cre-CtnnbΔex3 mice (P = .013 for CD4 and P = .007 for CD8). The fraction of DPs significantly increased in CD4Cre-CtnnbΔex3 (P = .001) and LckCre-CtnnbΔex3 (P = .001) compared to LckCre mice. The fraction of SPs was significantly reduced in CD4Cre-CtnnbΔex3 (P = .001 for CD4+ and CD8+) and LckCre-CtnnbΔex3 (P = .001 for CD4+ and CD8+). Reduction in the fraction of SPs was comparable between CD4Cre-CtnnbΔex3 and LckCre-CtnnbΔex3 mice (P = .14 for CD4+ and P = .34 for CD8+).
Figure 2
Figure 2
Stabilization of β-catenin induces a DP to SP developmental block. (A) The kinetics of developing CD4Cre-CtnnbΔex3 thymocytes were investigated by BrdU incorporation studies. Analysis of the BrdU content in the indicated subsets was done after electronic gating on subsets defined by expression of CD4, CD8, and TCRβ. Histograms are representative of BrdU incorporation at day 9 of treatment. Bars indicate gates for BrdU+ or BrdU cells and the numbers above the bars indicate percentages of labeled or unlabeled cells in each subset. (B) Turnover of CD4+CD8+ (DP) and production rate of mature single-positive (CD4 SP and CD8 SP) thymocytes. Mature thymocytes are defined as TCRβ hi and either CD4+CD8 or CD4CD8+. The percentages of labeled cells of control and CD4Cre-CtnnbΔex3 mice are shown. Two to 4 control and CD4Cre-CtnnbΔex3 mice were in each time point.
Figure 3
Figure 3
β-catenin induces T-cell lymphomas. (A) CD4/CD8 profile of β-catenin–dependent lymphomas. Thymocytes from the indicated mice or thymic lymphomas were stained with antibodies against CD4, CD8 and analyzed by FACS. (B) Surface expression of TCRβ and intracellular expression of β-catenin in the indicated subsets analyzed by FACS. Thymocytes were surface stained with antibodies against CD4, CD8 as well as TCRβ. To evaluate intracellular β-catenin expression, surface-stained thymocytes were permeabilized and stained with anti–β-catenin FITC. Profiles presented in panels B-C are representative of 4 independent experiments. (C) Western blot analysis of β-catenin protein expression in total thymocytes isolated from LckCre (lanes 1-2), LckCre-CtnnbΔex3 (lane 3), and CD4Cre-CtnnbΔex3 (lane 4) mice, as well as LckCre-CtnnbΔex3 (lane 5) and CD4Cre-CtnnbΔex3 lymphomas (lanes 6-7). GAPDH was used as loading control. (D) Fraction of DP thymocytes and transformed cells in S/G2/M phase of the cell cycle. Thymocytes or lymphomas were stained with antibodies to CD4, CD8 followed by intracellular staining with 7AAD. DP cells were gated and the percentage of cells in the S/G2/M phase from 4 to 6 independent experiments was averaged and plotted in the bar histograms. Error bars represent standard error values.
Figure 4
Figure 4
β-Catenin lymphomas are malignant as well as oligoclonal. (A) Genomic DNA was prepared from LckCre thymocytes (lane 1), LckCre-CtnnbΔex3 lymphomas (lanes 2-4), and CD4Cre-CtnnbΔex3 lymphomas (lanes 5-8) and digested with EcoRI. Digested DNAs were electrophoresed through agarose gels and blotted onto nitrocellulose. Southern blots were probed with a P32-labeled 1.2-kb EcoRI-ClaI genomic fragment recognizing the Jβ2 region of the TCRβ gene locus (“Materials and methods”). g.l. indicates the fragment expected for the germ-line TCRβ gene configuration. (B) CD4Cre-CtnnbΔex3 thymocytes or CD4Cre-CtnnbΔex3– and LckCre-CtnnbΔex3–derived lymphomas (2 × 10⁵ cells) were injected into sublethally irradiated Rag2−/−γc−/− double knock-out mice by tail vein injection. Injected mice were bled on the day of the injection and then weekly starting at 2 weeks after injection. CD4/CD8 profiles of white blood cells from injected Rag2−/−γc−/− mice. Profiles are representative of 2 independent transfer experiments involving 9 recipients and 3 independent tumors (2 CD4Cre-CtnnbΔex3 and 1 LckCre-CtnnbΔex3). (C) Expression of TCRβ (black) compared to isotype control (gray) or β-catenin (black) compared to isotype control (gray) in DP splenocytes at 5 weeks after adoptive transfer.
Figure 5
Figure 5
β-Catenin–mediated lymphomagenesis requires Rag activity. (A) Kaplan-Meyer tumor-free survival curves of LckCre-CtnnbΔex3, CD4Cre-CtnnbΔex3, LckCre-CtnnbΔex3-TCR(CL4)-Rag2−/−, LckCre-CtnnbΔex3-TCR(6.5)-Rag2−/−, and CD4Cre-CtnnbΔex3-pTα−/− mice. Mice were observed for 160 days after birth. The median latency of lymphoma development in LckCre-CtnnbΔex3, CD4Cre-CtnnbΔex3, and CD4Cre-CtnnbΔex3-pTα−/− mice was 99, 114, and 104 days, respectively, with a penetrance of 88%, 66%, and 53%, respectively. Log-rank tests indicated that CD4Cre-CtnnbΔex3 and LckCre-CtnnbΔex3 mice had significantly different disease-free survival curves (P = .007), while LckCre-CtnnbΔex3 and CD4Cre-CtnnbΔex3-pTa−/− mice have similar disease-free survival curves (P = .88). No lymphomas developed in LckCre-CtnnbΔex3-Rag2−/−, LckCre-CtnnbΔex3-TCR(CL4)-Rag2−/−, and LckCre-CtnnbΔex3-TCR(6.5)-Rag2−/− mice during the same period. (B) CD4/CD8profiles of lymphomas from the indicated mice. (C) (Histogram overlay left) Intracellular levels of β-catenin. (Histogram overlay right) Surface expression of TCRβ. The profiles presented are representative of 3 independent experiments.
Figure 6
Figure 6
β-Catenin lymphomas do not show Notch activation. (A) Illustration of the expression of Notch family members and target genes that show significant (P < .05) expression changes when comparing microarray data from control LckCre to CD4Cre-CtnnbΔex3 pretransformed thymocytes or the resulting lymphomas. Expression changes are color coded; red indicates up-regulation and blue indicates down-regulation. Columns represent independent RNA preparations as indicated. Rows are independent genes; the identity and accession number of the genes is indicated. (B) Semiquantitative RT-PCR of Notch1, Notch3, Deltex1, Hes1, and Lunatic-Fringe transcription (“Materials and methods”). RNA was isolated from sorted DP thymocytes of LckCre control (lane 1), and CD4Cre-CtnnbΔex3 thymocytes (lane 2), as well as 3 independent CD4Cre-CtnnbΔex3 lymphomas (lanes 3-5). RT-PCR for β-actin was used to equilibrate the samples. Two 5-fold serial dilutions are shown.
Figure 7
Figure 7
c-Myc is induced during β-catenin lymphomagenesis and it is required for transformation. (A) Northern blot analyses using RNAs extracted from LckCre (lanes 1-2), LckCre-CtnnbΔex3 (lane 3), CD4Cre-CtnnbΔex3 (lane 4) thymocytes, as well as from 2 independent LckCre-CtnnbΔex3 (lanes 5-6) and 1 CD4Cre-CtnnbΔex3 (lanes 7-9) lymphomas. Blots were hybridized with P32-labeled probes for the indicated genes (“Materials and methods”). (B) Western blot analysis showing stabilization of β-catenin and DNA-PCR showing deletion of c-Myc floxed allele in sorted DP thymocytes from CD4Cre (lane 1), CD4Cre-CtnnbΔex3 (lane 2), CD4Cre-Mycfl/fl (lane 3), and CD4Cre-CtnnbΔex3-Mycfl/fl (lane 4) mice. (C) CD4/CD8 profiles of CD4Cre-Mycfl/fl and CD4Cre-CtnnbΔex3-Mycfl/fl thymi. (D) Kaplan-Meyer tumor-free survival curves of CD4Cre-CtnnbΔex3-Mycfl/+ and CD4Cre-CtnnbΔex3-Mycfl/fl mice. The median latency of lymphoma was 101 days and the incidence of lymphoma was 70% in CD4Cre-CtnnbΔex3-Mycfl/+ mice.

References

    1. Behrens J, Jerchow BA, Wurtele M, et al. Functional interaction of an axin homolog, conductin, with beta-catenin, APC, and GSK3beta. Science. 1998;280:596–599. - PubMed
    1. Kishida S, Yamamoto H, Ikeda S, et al. Axin, a negative regulator of the wnt signaling pathway, directly interacts with adenomatous polyposis coli and regulates the stabilization of beta-catenin. J Biol Chem. 1998;273:10823–10826. - PubMed
    1. Ikeda S, Kishida S, Yamamoto H, Murai H, Koyama S, Kikuchi A. Axin, a negative regulator of the Wnt signaling pathway, forms a complex with GSK-3beta and beta-catenin and promotes GSK-3beta-dependent phosphorylation of beta-catenin. Embo J. 1998;17:1371–1384. - PMC - PubMed
    1. Aberle H, Bauer A, Stappert J, Kispert A, Kemler R. beta-catenin is a target for the ubiquitin-proteasome pathway. Embo J. 1997;16:3797–3804. - PMC - PubMed
    1. Cook D, Fry MJ, Hughes K, Sumathipala R, Woodgett JR, Dale TC. Wingless inactivates glycogen synthase kinase-3 via an intracellular signalling pathway which involves a protein kinase C. Embo J. 1996;15:4526–4536. - PMC - PubMed

Publication types