. 2007 Mar 7;26(5):1303-14.
doi: 10.1038/sj.emboj.7601597. Epub 2007 Feb 22.

Cdt1 associates dynamically with chromatin throughout G1 and recruits Geminin onto chromatin

Affiliations

Cdt1 associates dynamically with chromatin throughout G1 and recruits Geminin onto chromatin

Georgia Xouri et al. EMBO J. .

Abstract

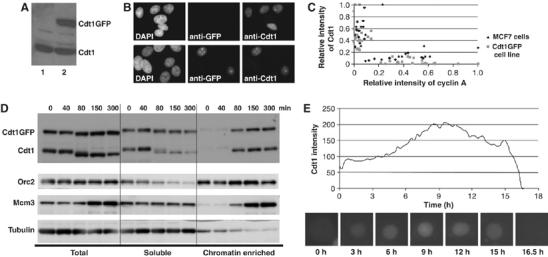
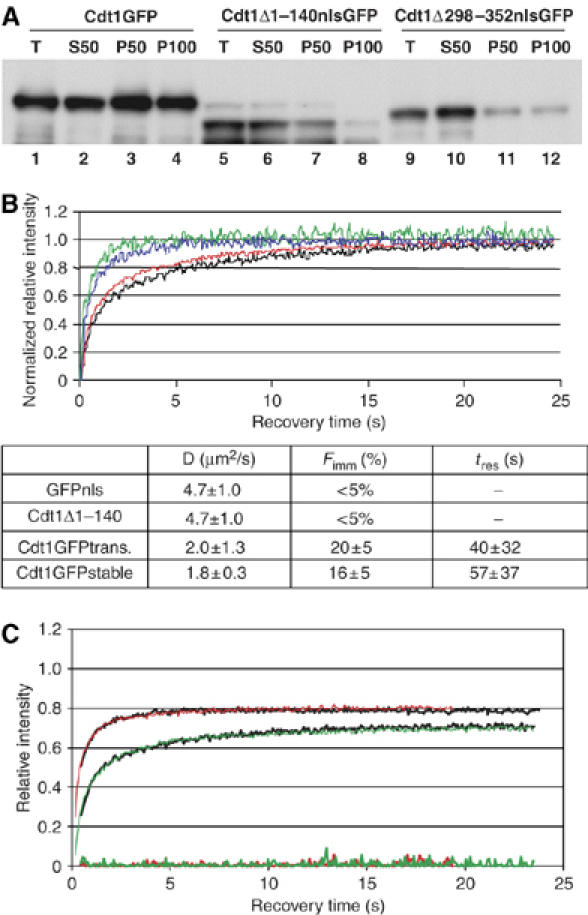
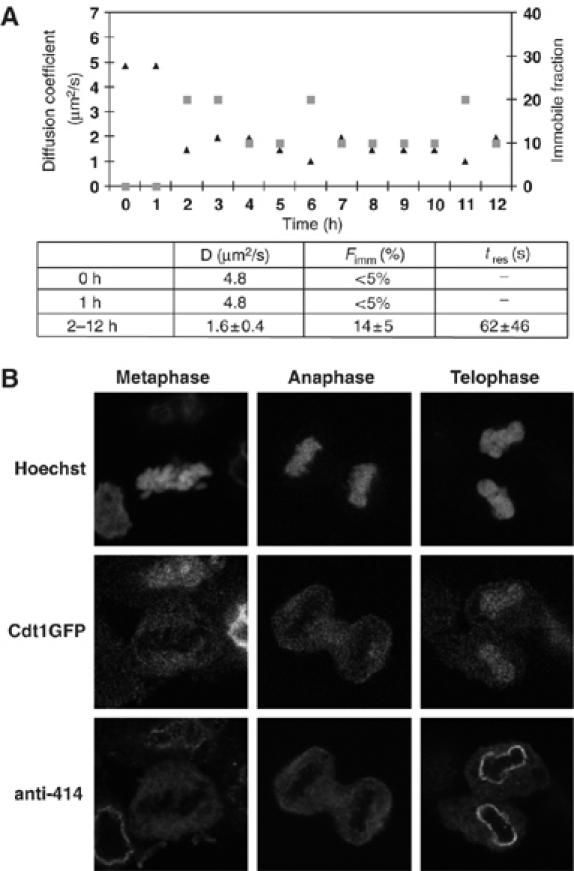
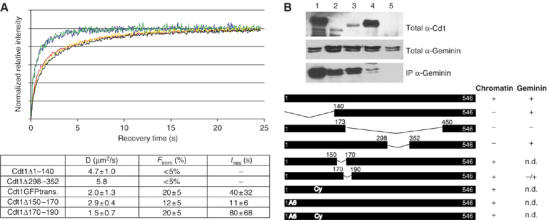
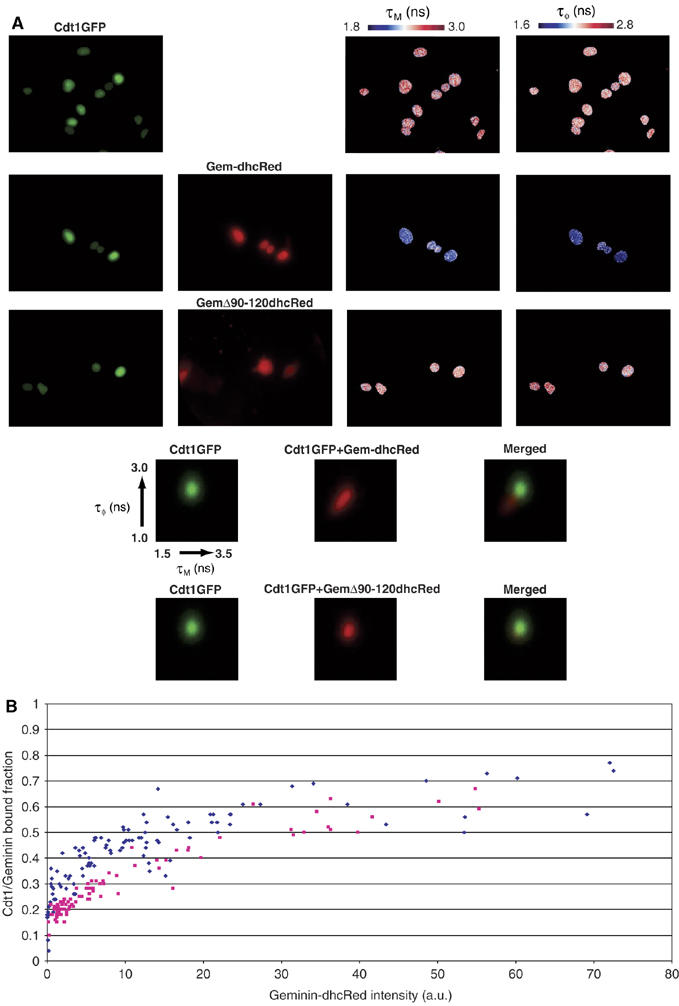
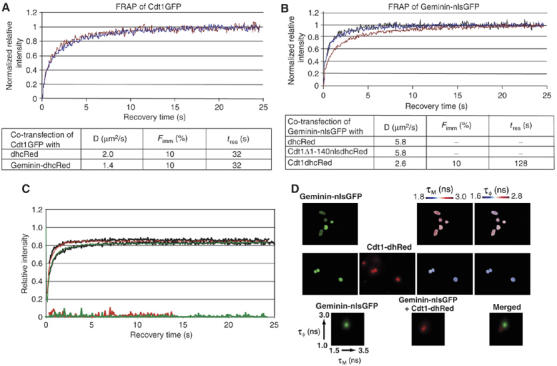
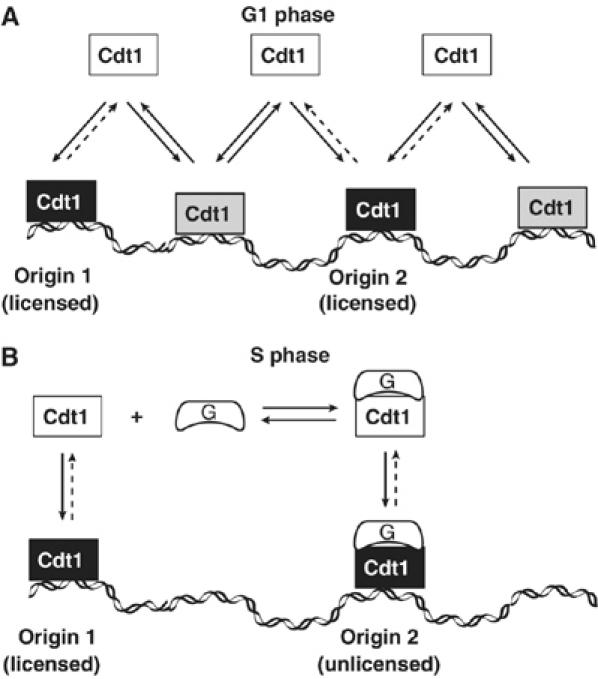
To maintain genome integrity, eukaryotic cells initiate DNA replication once per cell cycle after assembling prereplicative complexes (preRCs) on chromatin at the end of mitosis and during G1. In S phase, preRCs are disassembled, precluding initiation of another round of replication. Cdt1 is a key member of the preRC and its correct regulation via proteolysis and by its inhibitor Geminin is essential to prevent premature re-replication. Using quantitative fluorescence microscopy, we study the interactions of Cdt1 with chromatin and Geminin in living cells. We find that Cdt1 exhibits dynamic interactions with chromatin throughout G1 phase and that the protein domains responsible for chromatin and Geminin interactions are separable. Contrary to existing in vitro data, we show that Cdt1 simultaneously binds Geminin and chromatin in vivo, thereby recruiting Geminin onto chromatin. We propose that dynamic Cdt1-chromatin associations and the recruitment of Geminin to chromatin provide spatio-temporal control of the licensing process.


Figures

Figure 1
Figure 1
Characterization of the Cdt1GFP stably expressing cell line. (A) Western blot analysis of total cell extracts using anti-Cdt1-specific antibodies. Lane 1: MCF7 cells, lane 2: Cdt1GFP-expressing cell line. (B) Parental MCF7 (upper) or Cdt1GFP-expressing (lower) cell lines were subjected to immunofluorescence with anti-GFP-(middle) and anti-Cdt1-(right) specific antibodies and counter-stained with DAPI (left). (C) 2D scatter plots showing relative intensity of Cdt1 (by indirect immunofluorescence) or Cdt1GFP (GFP fluorescence) against relative intensity of cyclin A (indirect immunofluorescence) in individual cells from the parental MCF7 (black diamond) or the Cdt1GFP-expressing (grey square) cell line respectively. Intensities in 30 cells were quantified for each cell line. (D) Subcellular fractionation of Cdt1GFP-expressing cells. Cells were synchronized in mitosis by a nocodazole block and time points taken as they progressed into G1. Total cell lysates (lanes 1–5) were fractionated into a soluble fraction (lanes 6–10) and a chromatin-enriched fraction (lanes 11–15) as described previously (Nishitani et al, 2004). An anti-Cdt1 antibody was used to detect Cdt1GFP and endogenous Cdt1, whereas Orc2, Mcm3 and tubulin served as controls. (E) Time-lapse analysis of Cdt1GFP. Cdt1GFP intensity in a cell exiting mitosis into G1 is depicted. Images were recorded every 15 min. Representative images are shown at the bottom.
Figure 2
Figure 2
FRAP of Cdt1GFP reveals dynamic chromatin association. (A) Chromatin association of wild-type and mutant Cdt1 forms. MCF7 cells were transfected with Cdt1GFP (lanes 1–4), Cdt1Δ1–140nlsGFP (lanes 5–8) or Cdt1Δ298–352nlsGFP (lanes 9–12) and total cell extracts (lanes 1, 5 and 9) fractionated into soluble (lanes 2, 6 and 10) and chromatin enriched fractions in the presence of 50 mM NaCl (lanes 3, 7 and 11) or 100 mM NaCl (lanes 4, 8 and 12). All fractions were Western blotted with anti-Cdt1 antibodies. Reduced recovery in chromatin-enriched fractions of Cdt1Δ1–140 and Cdt1Δ298–352 as compared to wild-type Cdt1 is evident. (B) Fluorescence recovery over time of Cdt1GFP (black: stable cell line, red: transiently transfected), Cdt1Δ1–140nlsGFP (blue, transiently transfected) and GFPnls (green, transiently transfected). Lower panel: diffusion coefficient (D), immobile fraction (Fimm) and duration of immobilization (tres, representing residence time in immobile chromatin-associated complexes), as estimated from fitting the data using computer simulations. FRAP curves are normalized from 0 to 1 to allow direct comparison of the data. (C) Overlay of simulated curves for Cdt1GFP (green line, D=1.9 μm2/s, Fimm=20% and tres=64 s) and Cdt1Δ1–140nlsGFP (red line, D=4.8 μm2/s, no immobile fraction), to experimentally obtained data (black lines). The residuals of the fittings are shown at the bottom of the graph. For parameter identification, FRAP data normalized to prebleach values only were used, to avoid masking of the immobilized fraction by normalization (Houtsmuller, 2005).
Figure 3
Figure 3
Cdt1GFP shows dynamic chromatin association during G1. (A) Diffusion coefficient (D—triangles) and immobile fraction (Fimm—squares) of Cdt1GFP plotted against time (in hours) after release of mitotic block by thymidine-nocodazole on Cdt1GFP-expressing cells (stable cell line): 0–1 h (mitosis), 2–12 h (G1 phase). The diffusion coefficient (D), immobile fraction (Fimm) and the duration of immobilization of this fraction (tres) as estimated from fitting the data to recovery curves generated by computer simulations, are shown at the bottom. (B) Confocal images during mitosis show that Cdt1GFP, present at low levels in early mitosis, is excluded from chromatin until anaphase, whereas it colocalizes with chromatin during telophase, concomitant with the formation of the nuclear envelope. DNA staining by Hoechst and staining for nucleoporins (anti-414) were used to discriminate mitotic stages from a population of asynchronous cells.
Figure 4
Figure 4
Mapping of Cdt1 regions required for chromatin association in vivo, assessed by FRAP. (A) Fluorescence recovery over time of Cdt1GFP (red), Cdt1Δ1–140nlsGFP (blue), Cdt1Δ298–352nlsGFP (green), Cdt1Δ150–170GFP (yellow) and Cdt1Δ170–190GFP (black) transiently transfected in MCF7 cells. The diffusion coefficient (D), immobile fraction (Fimm) and the duration of immobilization of this fraction (tres) are shown at the bottom. (B) Geminin interactions of wild-type Cdt1 and mutants used in this study. Cdt1GFP (lane 1), Cdt1Δ1–140nlsGFP (lane 2), Cdt1Δ298–352nlsGFP (lane 3), Cdt1Δ170–190GFP (lane 4) or GFPnls (lane 5) were transfected into MCF7 cells together with Geminin-dhcRed. Total cell extracts (first Western blot anti-Cdt1, second Western blot anti-Geminin) were immunoprecipitated with anti-GFP antibodies and the presence of Geminin-dhcRed in the immunoprecipitate assessed by Western blotting (third Western plot). Cdt1Δ170–190 shows greatly reduced association with Geminin, though still detectable binding above background levels. Lower panel: schematic representation of the mutant forms of Cdt1 used for FRAP analysis. Their ability (+) or inability (−) to exhibit wild-type kinetics of fluorescence recovery (chromatin) and to co-immunoprecipitate with Geminin is shown on the right. Mutants Δ1–140, Δ298–352 and Cdt1Cy, which failed to localize correctly to the nucleus, were fused to three copies of the SV40 nuclear localization sequence at the C terminus of the molecule, before the GFP. Wild type Cdt1nlsGFP showed identical kinetics to Cdt1GFP (data not shown). n.d. not determined.
Figure 5
Figure 5
Cdt1 interacts with Geminin in vivo. (A) FLIM was used to assess interactions of Cdt1GFP with Geminin-dhcRed and GemininΔ90–120dhcRed in living MCF7 cells following transient transfection. GFP fluorescence, hcRed fluorescence, GFP modulation (τM, 1.8–3.0 ns) and phase (τϕ, 1.6–2.8 ns) lifetimes are shown. Cumulative 2D histograms (50–100 cells) of phase and modulation lifetimes of Cdt1GFP with (red) and without (green) cotransfection of Geminin-dhcRed or GemininΔ90–120dhcRed are shown at the bottom. (B) Relative fraction of Cdt1GFP in complex with GeminindhcRed (blue dots) or GemininΔ90–120dhcRed (red dots) as a function of GeminindhcRed expression. Data were acquired in 100 different cells. Average complex fractions are plotted against the average intensity of dhcRed for each cell.
Figure 6
Figure 6
Cdt1 recruits Geminin onto chromatin. (A) Coexpression of Geminin does not affect the mobility of Cdt1GFP. Cdt1GFP fluorescence recovery curves in the presence of vector dhcRed (red line) or GeminindhcRed (blue line). Diffusion coefficient (D), % immobile fraction (Fimm) and duration of immobilization (tres) derived from fitting the data on computer-simulated curves as above are shown. (B) Coexpression of Cdt1 affects the mobility of Geminin. Geminin-nlsGFP fluorescence recovery curves in cells coexpressing Cdt1dhcRed (red line), Cdt1Δ1–140-nlsdhcRed (blue line) or vector dhcRed (black line). Diffusion coefficient (D), immobile fraction (Fimm) and duration of immobilization (tres) are shown. Geminin-nlsGFP data were best fitted by only one, freely diffusing component. (C) A computer simulation was used to fit the Geminin-nlsGFP recovery curves (black lines) in the presence of Cdt1Δ1–140-nlsdhcRed (upper graph) or in the presence of Cdt1 (lower graph) with a model that contains two components (free diffusion and one binding fraction — red lines). The residuals of the fittings are shown at the bottom of the graph. (D) Geminin-nlsGFP and Cdt1dhcRed interactions in living cells were measured by fluorescence lifetime imaging microscopy following transient transfection. Cumulative 2D histograms of phase and modulation lifetimes of Geminin-nlsGFP before (green) and after (red) cotransfection of Cdt1 are shown at the bottom.
Figure 7
Figure 7
Model for the regulation of licensing through dynamic Cdt1–chromatin association and Geminin recruitment onto chromatin. (A) During G1 phase, Cdt1 continuously scans chromatin (short-lived interactions: gray boxes) while interacting more tightly (long-lived interactions: black boxes) with the appropriate origins of replication (origin 1 and origin 2). (B) At the onset of S phase, Geminin accumulates and is recruited by Cdt1 onto chromatin to determine the origins of replication where the licensing process is inhibited (origin 2, but not origin 1). By recruiting the inhibitory Geminin–Cdt1 complex only to origins that have fired, a tight spatial–temporal regulation of the licensing process is achieved.

Similar articles

Cited by

References

    1. Aparicio OM, Weinstein DM, Bell SP (1997) Components and dynamics of DNA replication complexes in S. cerevisiae: redistribution of MCM proteins and Cdc45p during S phase. Cell 91: 59–69 - PubMed
    1. Arias EE, Walter JC (2006) PCNA functions as a molecular platform to trigger Cdt1 destruction and prevent re-replication. Nat Cell Biol 8: 84–90 - PubMed
    1. Ballabeni A, Melixetian M, Zamponi R, Masiero L, Marinoni F, Helin K (2004) Human Geminin promotes pre-RC formation and DNA replication by stabilizing CDT1 in mitosis. EMBO J 23: 3122–3132 - PMC - PubMed
    1. Bastiaens PI, Squire A (1999) Fluorescence lifetime imaging microscopy: spatial resolution of biochemical processes in the cell. Trends Cell Biol 9: 48–52 - PubMed
    1. Bell SP, Dutta A (2002) DNA replication in eukaryotic cells. Annu Rev Biochem 71: 333–374 - PubMed

Publication types