

Hand sensory-motor cortical network assessed by functional source separation
- PMID: 17318837
- PMCID: PMC6870883
- DOI: 10.1002/hbm.20367
Hand sensory-motor cortical network assessed by functional source separation
Abstract
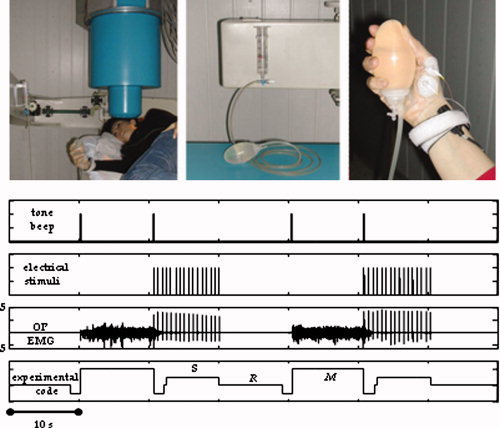
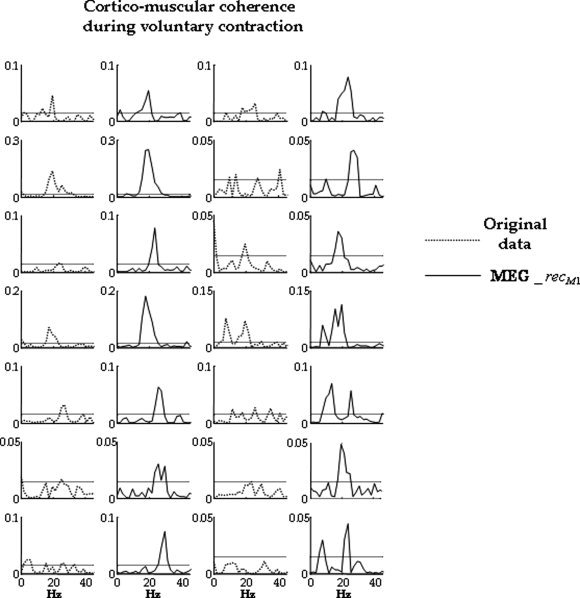
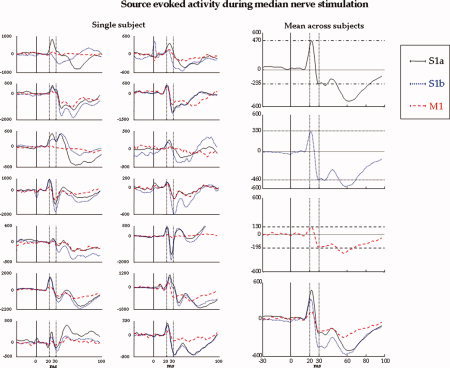
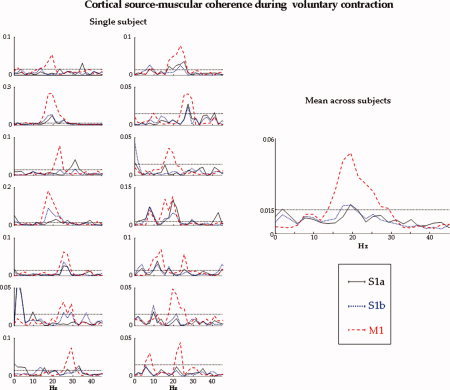
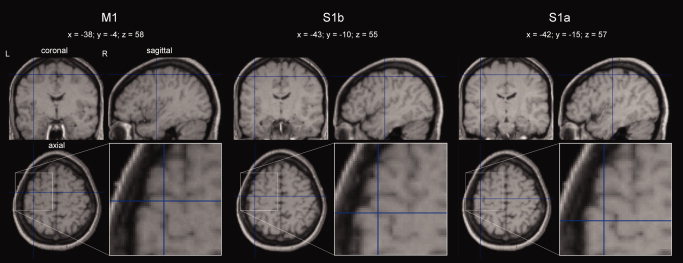
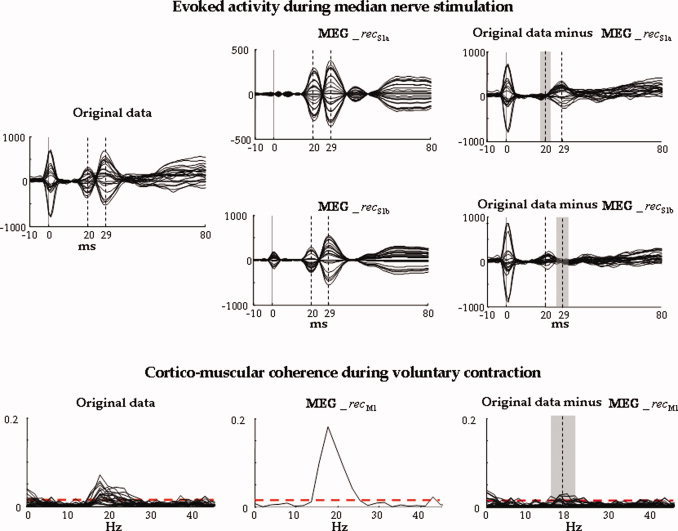
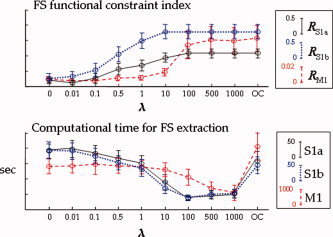
The functional source separation procedure (FSS) was applied to identify the activities of the primary sensorimotor areas (SM1) devoted to hand control. FSS adds a functional constraint to the cost function of the basic independent component analysis, and obtains source activity all along different processing states. Magnetoencephalographic signals from the left SM1 were recorded in 14 healthy subjects during a simple sensorimotor paradigm--galvanic right median nerve stimuli intermingled with submaximal isometric thumb opposition. Two functional sources related to the sensory flow in the primary cortex were extracted requiring maximal responsiveness to the nerve stimulation at around 20 and 30 ms (S1a, S1b). Maximal cortico-muscular coherence was required for the extraction of the motor source (M1). Sources were multiplied by the Euclidean norm of their corresponding weight vectors, allowing amplitude comparisons among sources in a fixed position. In all subjects, S1a, S1b, M1 were successfully obtained, positioned consistently with the SM1 organization, and behaved as physiologically expected during the movement and processing of the sensory stimuli. The M1 source reacted to the nerve stimulation with higher intensity at latencies around 30 ms than around 20 ms. The FSS method was demonstrated to be able to obtain the dynamics of different primary cortical network activities, two devoted mainly to sensory inflow, and the other to the motor control of the contralateral hand. It was possible to observe each source both during pure sensory processing and during motor tasks. In all conditions, a direct comparison of source intensities can be achieved.
Figures
Similar articles
-
Movement-induced uncoupling of primary sensory and motor areas in focal task-specific hand dystonia.Neuroscience. 2013 Oct 10;250:434-45. doi: 10.1016/j.neuroscience.2013.07.027. Epub 2013 Jul 20. Neuroscience. 2013. PMID: 23876327
-
Hand somatosensory subcortical and cortical sources assessed by functional source separation: an EEG study.Hum Brain Mapp. 2009 Feb;30(2):660-74. doi: 10.1002/hbm.20533. Hum Brain Mapp. 2009. PMID: 18266219 Free PMC article.
-
Sensory-motor interaction in primary hand cortical areas: a magnetoencephalography assessment.Neuroscience. 2006 Aug 11;141(1):533-42. doi: 10.1016/j.neuroscience.2006.03.059. Epub 2006 May 18. Neuroscience. 2006. PMID: 16713107
-
Stimulus-driven changes in sensorimotor behavior and neuronal functional connectivity application to brain-machine interfaces and neurorehabilitation.Prog Brain Res. 2011;192:83-102. doi: 10.1016/B978-0-444-53355-5.00006-3. Prog Brain Res. 2011. PMID: 21763520 Review.
-
Neuromagnetic integrated methods tracking human brain mechanisms of sensorimotor areas 'plastic' reorganisation.Brain Res Brain Res Rev. 2000 Sep;33(2-3):131-54. doi: 10.1016/s0169-328x(00)00090-5. Brain Res Brain Res Rev. 2000. PMID: 11011062 Review.
Cited by
-
Effects of Independent Component Analysis on Magnetoencephalography Source Localization in Pre-surgical Frontal Lobe Epilepsy Patients.Front Neurol. 2020 Jun 2;11:479. doi: 10.3389/fneur.2020.00479. eCollection 2020. Front Neurol. 2020. PMID: 32582009 Free PMC article.
-
A New, High-Efficacy, Noninvasive Transcranial Electric Stimulation Tuned to Local Neurodynamics.J Neurosci. 2018 Jan 17;38(3):586-594. doi: 10.1523/JNEUROSCI.2521-16.2017. Epub 2017 Dec 1. J Neurosci. 2018. PMID: 29196322 Free PMC article.
-
Developmental tuning and decay in senescence of oscillations linking the corticospinal system.J Neurosci. 2010 Mar 10;30(10):3663-74. doi: 10.1523/JNEUROSCI.5621-09.2010. J Neurosci. 2010. PMID: 20220000 Free PMC article.
-
Primary sensory and motor cortex activities during voluntary and passive ankle mobilization by the SHADE orthosis.Hum Brain Mapp. 2011 Jan;32(1):60-70. doi: 10.1002/hbm.20998. Hum Brain Mapp. 2011. PMID: 20336689 Free PMC article.
-
The spatiospectral characterization of brain networks: fusing concurrent EEG spectra and fMRI maps.Neuroimage. 2013 Apr 1;69:101-11. doi: 10.1016/j.neuroimage.2012.12.024. Epub 2012 Dec 22. Neuroimage. 2013. PMID: 23266744 Free PMC article.
References
-
- Allison T, McCarthy G, Wood CC, Jones, SJ ( 1991): Potentials evoked in human and monkey cerebral cortex by stimulation of the median nerve. A review of scalp and intracranial recordings. Brain 114: 2465–2503. - PubMed
-
- Brown P ( 2000): Cortical drives to human muscle: The Piper and related rhythms. Prog Neurobiol 60: 97–108. Review. - PubMed
-
- Brown P, Marsden JF ( 2001): Cortical network resonance and motor activity in humans. Neuroscientist 7: 518–527. - PubMed
Publication types
MeSH terms
LinkOut - more resources
Full Text Sources
