. 2007 Mar 20;46(11):3423-34.
doi: 10.1021/bi061854k. Epub 2007 Feb 24.

Cardiolipin switch in mitochondria: shutting off the reduction of cytochrome c and turning on the peroxidase activity

Affiliations

Cardiolipin switch in mitochondria: shutting off the reduction of cytochrome c and turning on the peroxidase activity

Liana V Basova et al. Biochemistry. .

Abstract

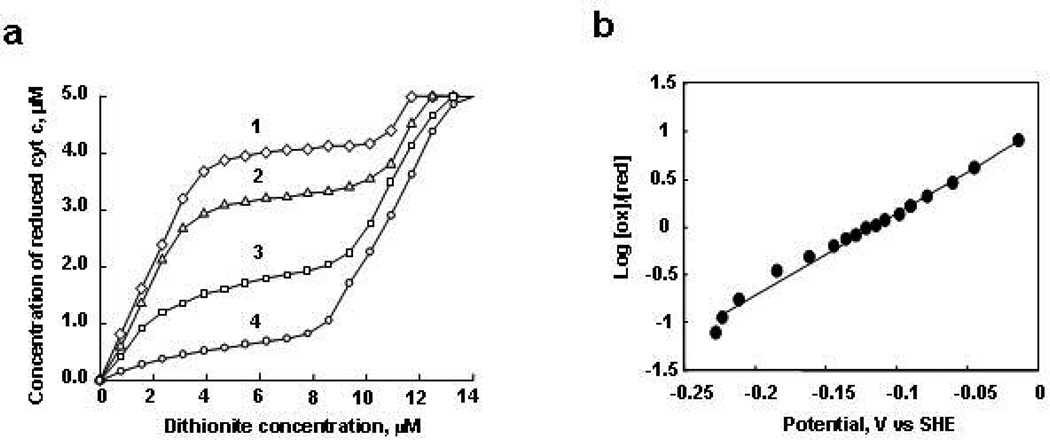
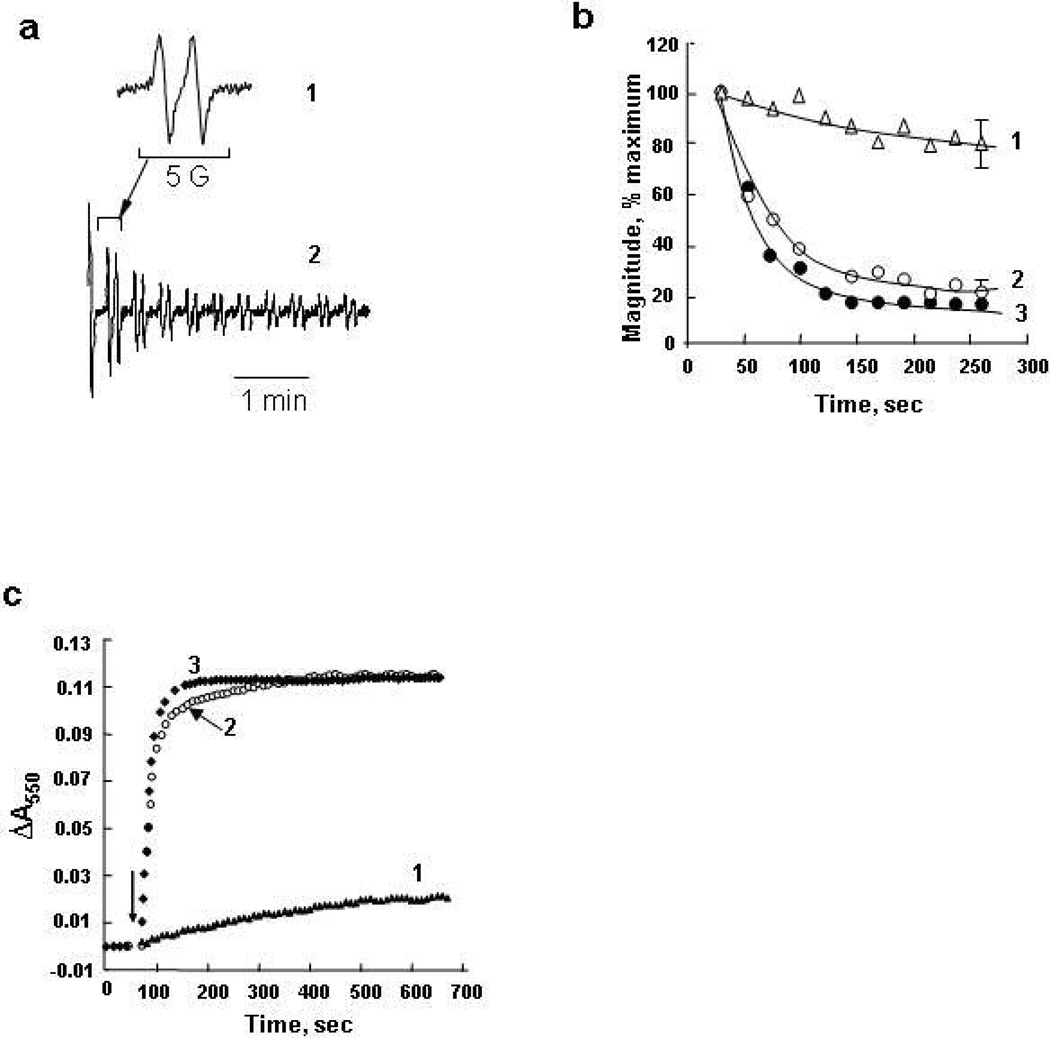
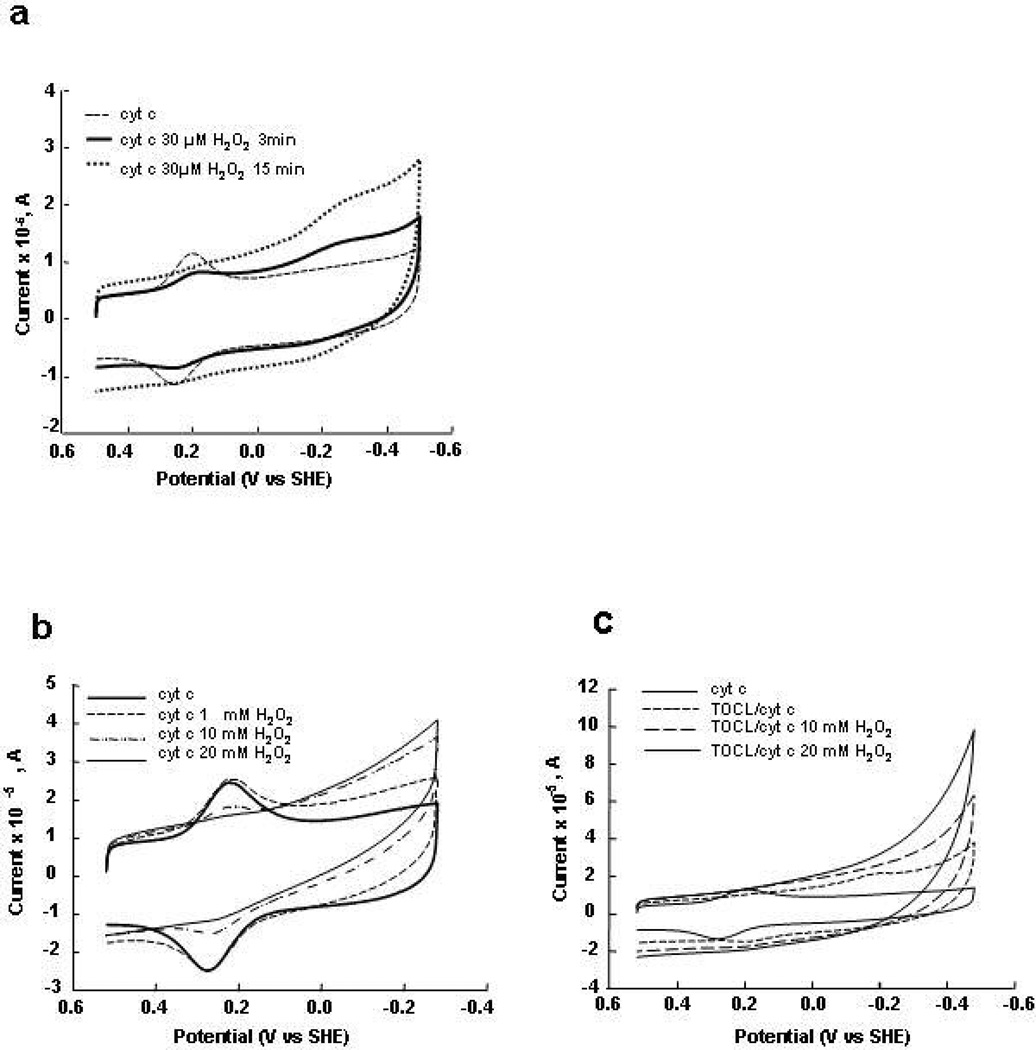
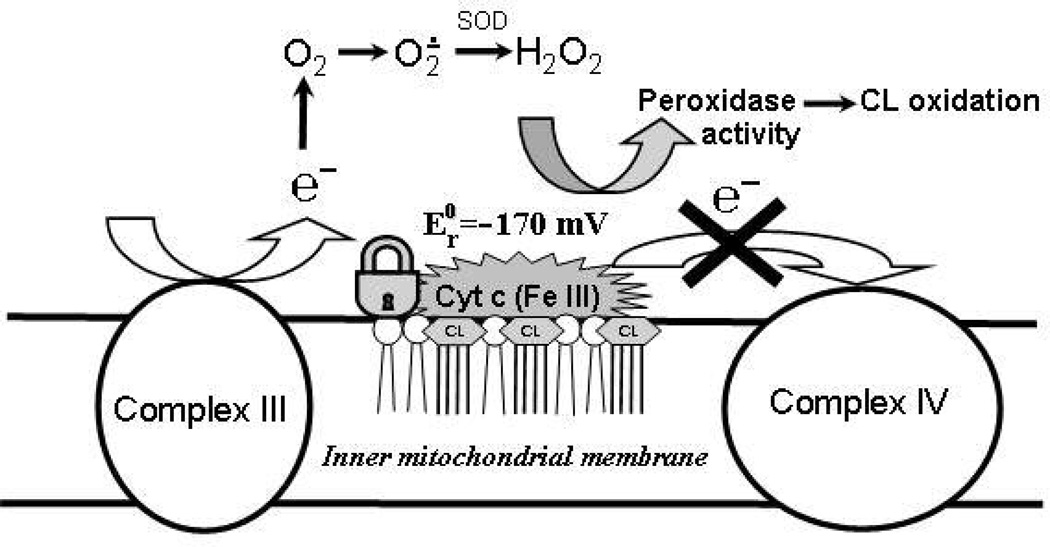
Upon interaction with anionic phospholipids, particularly mitochondria-specific cardiolipin (CL), cytochrome c (cyt c) loses its tertiary structure and its peroxidase activity dramatically increases. CL-induced peroxidase activity of cyt c has been found to be important for selective CL oxidation in cells undergoing programmed death. During apoptosis, the peroxidase activity and the fraction of CL-bound cyt c markedly increase, suggesting that CL may act as a switch to regulate cyt c's mitochondrial functions. Using cyclic voltammetry and equilibrium redox titrations, we show that the redox potential of cyt c shifts negatively by 350-400 mV upon binding to CL-containing membranes. Consequently, functions of cyt c as an electron transporter and cyt c reduction by Complex III are strongly inhibited. Further, CL/cyt c complexes are not effective in scavenging superoxide anions and are not effectively reduced by ascorbate. Thus, both redox properties and functions of cyt c change upon interaction with CL in the mitochondrial membrane, diminishing cyt c's electron donor/acceptor role and stimulating its peroxidase activity.


Figures

Figure 1
Figure 1
Cyclic voltammograms for cyt c covalently (a, b) and electrostatically (c, d) attached to carboxylic acid-terminated SAM covered gold electrodes in the presence of liposomes: 4 mM TOCL/DOPC 1:1 (a, c) and 4 mM DOPC alone (b, d). a) Changes of the voltammograms of cyt c in the presence of TOCL-liposomes were measured every 15 min during 60 min; b) cyt c in the presence of DOPC after incubation during 60 min; c) cyt c after incubation in TOCL liposomes during 5 and 15 min; d) cyt c in the presence DOPC after incubation during 45 min. The voltammograms of cyt c without liposomes (solid line) are shown for comparison on each figure. Measurements were performed in 10 mM phosphate buffer at pH 7.0 and a scan rate of 20 V/s.
Figure 2
Figure 2
Scan rate dependence for cyt c in the absence (a) and in the presence of TOCL (b). Dependence of the reduction current upon the scan rate for cyt c/TOCL complex is shown as well (c). Fits of the data to Marcus theory predictions are also shown for two different reorganization energies. See text for details.
Figure 3
Figure 3
Redox titration of cyt c in the presence of TOCL by dithionite. a) Concentration dependence of reduced form of cyt c in the presence of TOCL and dithionite obtained by titration in the presence of gallocyanine (8 µM). The molar ratios of TOCL/cyt c were 25:1 (curve 1), 50:1 (curve 2), 100:1 (curve 3), 200:1 (curve 4); b) the Nernst plot obtained from spectro-electrochemical titration of cyt c (5 µM) in complex with TOCL at the molar ratio of 1:200 versus the potential range of indigo carmine (10 µM). Cyt c was incubated with liposomes for 15 min, and then a redox mediator was added. After this, titration by dithionite was started. 2 µL of stock solution of fresh dithionite (0.8 µM) was added 20 times, after each addition the absorbance spectra from 700 to 250 nm were measured. Each point represents addition of dithionite. Gallocyanine and indigo carmine were used as indicators of redox potential.
Figure 4
Figure 4
Effect of TOCL on cyt c reduction by ascorbate. a) EPR spectrum (1) and time course (2) of ascorbate radicals formed in the incubation medium containing cyt c and ascorbate (25 µM cyt c, 500 µM ascorbate, 20 mM phosphate and 100 µM DTPA, pH 7.4); b) time course of ascorbate radical generation in the absence (curves 3) or presence (curve 1, 2) of liposomes. Cyt c (25 µM) was incubated with DOPC or TOCL/DOPC liposomes (1 mM) for 5 min at 21°C then ascorbate (500 µM) was added and recording of EPR ascorbate radical signal was started in 30 sec. Results are normalized to the initial ascorbate radical signal intensity taken as 100%. c) time course of cyt c reduction by ascorbate in the presence and absence of TOCL/DOPC (1:1) and DOPC liposomes monitored by absorbance at 550 nm. Cyt c (5 µM, buffer 20 mM HEPES and 100 µM DTPA) was pre-incubate with TOCL/DOPC 1:1 (100 µM) for 15 min at room temperature then ascorbate (100 µM) was added and absorbance was measured during 10 min (curve 1). Cyt c at the same concentration in the presence of ascorbate (curve 3) and DOPC (400 µM) liposomes (curve 2) are shown for comparison. Arrow indicates the time point when ascorbate was added.
Figure 5
Figure 5
Cyt c reduction by superoxide radicals generated in xanthine/xanthine oxidase system. a) Time course of cyt c reduction by superoxide in the presence of TOCL/DOPC (curves 1,2) and DOPC (curve 3) liposomes and its absence (curve 4) monitored at 550 nm. Cyt c in the presence of DOPC (curve 3) and cyt c (curve 4) alone are shown for comparison. Arrow indicates the moment when xanthine oxidase was added; b) dependence of cyt c reduction by superoxide on lipids/cyt c ratio: TOCL/DOPC:cyt c 25:1 and 50:1 (curve 1,2 respectively), DOPC/cyt c 100:1 (curve 3) and cyt c alone (curve 4). Samples of cyt c (5 µM) were preincubated with TOCL/DOPC 1:1 liposomes at different concentrations for 15 min at room temperature in 20 mM Hepes buffer (plus 100 µM DTPA, pH 7.4). After the preincubation 25 µM xanthine (5 mM stock solution) was added and absorbance spectrum was recorded (the reference cuvette contained the same amount of liposomes). To start O2−• production xanthine oxidase was added (0.002 unit/ml). The time course of cyt c reduction was recorded every 10 sec measuring the absorption at 550 nm. After 5 min the total absorbance spectrum was recorded again. Differences between two spectra (ΔA550) were calculated after alignment in 530–570 nm region.
Figure 6
Figure 6
Effect of CL on the activities of purified Complex III and IV. a) Reduction of cyt c by Complex III in the absence (curve 1) and in the presence of TOCL/DOPC (curve 2) or DOPC liposomes (curve 3). Cyt c (25 µM) was pre-incubated for 15 min with liposomes (5mM); then Complex III was added (10 nM). The incubation system was composed of 20 mM HEPES with 100 µM DTPA, lauryl maltoside (0.1 %), decylubiquinol (100 µM), pH 7.4. Control experiments showing the reduction of cyt c in the presence of: a) lauryl maltoside (0.1 %) and decylubiquinol (100 µM) (curve 4); lauryl maltoside (0.1 %), decylubiquinol (100 µM) and myxothiazol (2.5 µM) (curve 5). Arrow indicates the addition Complex III. b) Oxidation of cyt c in the absence (curve 1) and in the presence (curve 2) of TOCL/DOPC liposomes by isolated Complex IV. Concentration of cyt c was 10 µM (alone) and 50 µM (in complex with TOCL); concentration of Complex IV was 50 nM. Buffer contained 20 mM HEPES (pH 7.4) with 100 µM DTPA, lauryl maltoside (0.1 %). Liposomes were pre-incubated with cyt c for 5 min. Arrow indicates the addition Complex IV.
Figure 7
Figure 7
Effect of cyt c on EPR signal of MNP reduced to MNP-H• in rat liver mitochondrial suspension. Mitochondrial suspension (4 mg protein/ml) in buffer (230 mM mannitol, 70 mM sucrose, 20 mM Tris/HCl, 2.5 mM phosphate, 0.5 mM EGTA, pH 7.4) was supplemented with 20 mM MNP and succinate (7.5 mM). Spectra of reduced MNP (MNP-H) were recorded 10 min after succinate addition. a) EPR spectrum of MNP-H: (1) - an experimental spectrum, (2) – computer simulation using hyperfine coupling constants aN=aHβ=14.4G. b) Magnitude of EPR signal of MNP-H. Control: magnitude of MNP-H signal after addition of succinate to mitochondrial suspension. Cyt c (20 µM) with or without liposomes (400 µM total lipid) was added to mitochondria before addition of succinate. The results are representative of five independent experiments. Data are presented as mean ±S.E. (n=3) (*, p<0.01 vs control; **, p<0.05 vs cyt c).
Figure 8
Figure 8
Cyclic voltammograms of cyt c electrostatically attached to carboxylic acid - terminated in the absence (dashed line) and the presence of 30 µM H2O2 after 3 (solid line) and 15 (dotted line) min incubation with H2O2. (a) Cyclic voltammograms of cyt c covalently attached to SAM at different concentrations of H2O2 in the absence (b) and presence of TOCL/DOPC liposomes (c). Cyt c was incubated with liposomes during 60 min and then H2O2 was added. The voltammograms were recorded after pre-incubation with H2O2 during 15 min under N2. The voltammograms of cyt c without liposomes at pH 7.0 are shown for comparison on both figures (solid line). Scan rate 20 V/s.
Scheme 1
Scheme 1
Interactions of cyt c with CL resulting in a drastic negative shift of the cyt c redox potential: a possible mechanism of disruption of mitochondrial electron transport and increased production of ROS.
Scheme 2
Scheme 2
Thermodynamic cycle of reduction and unfolding of cyt c in the presence of CL.

References

    1. Mathews CK, van Holde KE, Ahem KG. Biochemistry. third ed. San Francisco: Addison Wesley Longman; 1999.
    1. Pettigrew GW, Moore GR. Cytochrome c - Biological aspects. Berlin, Heidelberg: Springer-Verlaf; 1987.
    1. Pereverzev MO, Vygodina TV, Konstantinov AA, Skulachev VP. Cytochrome c an ideal antioxidant. Biochem Soc Trans. 2003;31:1312–1315. - PubMed
    1. Turrens JF. Mitochondrial formation of reactive oxygen species. J Physiol. 2003;552:335–344. - PMC - PubMed
    1. Gogvadze V, Orrenius S, Zhivotovsky B. Multiple pathways of cytochrome c release from mitochondria in apoptosis. Biochim Biophys Acta. 2006;1757:639–647. - PubMed

Publication types