. 2007 Feb 23;3(2):e35.
doi: 10.1371/journal.pcbi.0030035. Epub 2007 Jan 9.

Persistent activity in neural networks with dynamic synapses

Affiliations

Persistent activity in neural networks with dynamic synapses

Omri Barak et al. PLoS Comput Biol. .

Erratum in

  • PLoS Comput Biol. 2007 Mar;3(3):e70

Abstract

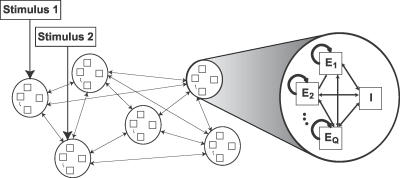
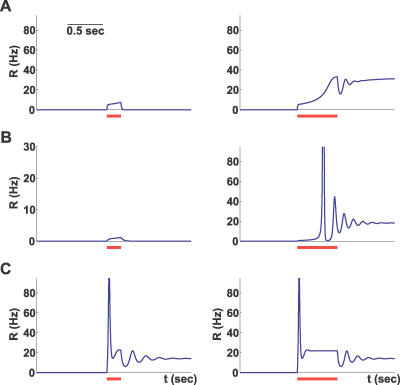
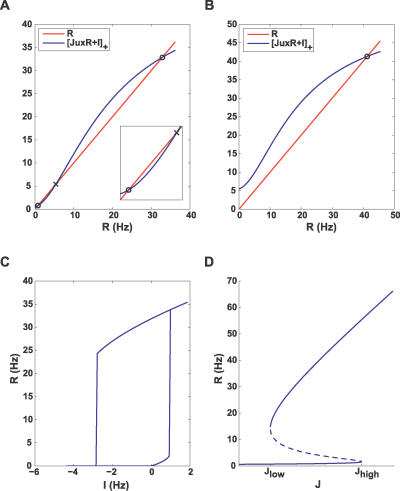
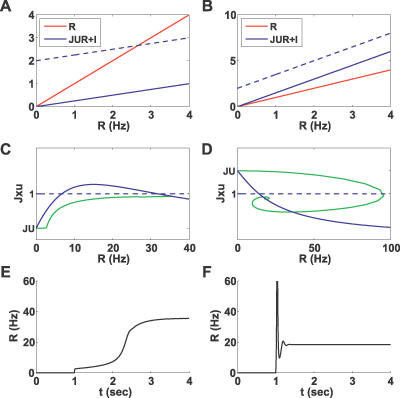
Persistent activity states (attractors), observed in several neocortical areas after the removal of a sensory stimulus, are believed to be the neuronal basis of working memory. One of the possible mechanisms that can underlie persistent activity is recurrent excitation mediated by intracortical synaptic connections. A recent experimental study revealed that connections between pyramidal cells in prefrontal cortex exhibit various degrees of synaptic depression and facilitation. Here we analyze the effect of synaptic dynamics on the emergence and persistence of attractor states in interconnected neural networks. We show that different combinations of synaptic depression and facilitation result in qualitatively different network dynamics with respect to the emergence of the attractor states. This analysis raises the possibility that the framework of attractor neural networks can be extended to represent time-dependent stimuli.


Conflict of interest statement

Competing interests. The authors have declared that no competing interests exist.

Figures

Figure 1
Figure 1. Network Structure
The network is divided into several populations, each responding primarily to a certain stimulus. Each population is further partitioned into subpopulations, differing in their synaptic properties. Connections are strongest within subpopulations, weaker between subpopulations, and weakest across populations.
Figure 2
Figure 2. Network Dynamics in Response to Transient Stimuli for Three Different Facilitation Levels
The three rows use parameter sets A, B, and C, respectively, with facilitation strongest in A and weakest in C (see Methods, Table 2). The red bars mark two stimulus durations of 200 and 700 ms for short and long bars, respectively. The stimulus magnitude is 4 Hz for A and C, and 0.2 Hz for B.
Figure 3
Figure 3. Steady State Analysis
(A,B) Steady state values of the firing rate shown as intersection points (circle, stable; cross, unstable) between the decay and recurrent excitation terms in Equation 2, for low, 0.5 Hz (A), and high, 5.5 Hz (B) external current. (C) Hysteresis plot showing stable steady states for different values of input. (D) Bifurcation diagram for I = 0.5 Hz, illustrating the steady states for different values of connection strength. The dashed line marks unstable equilibria. All subplots use parameter set A (see Methods, Table 2).
Figure 4
Figure 4. Fast Dynamics
Left and right columns use parameter sets A and C, respectively (see Methods, Table 2). (A,B) Steady state analysis similar to Figure 3, but with x,u frozen at their resting values (see Equation 4). The dashed line illustrates recurrent excitation after an external input is increased. Note that only in (A) does a steady state remain. (C,D) Steady state value of Jux as a function of R (solid blue line) overlaid with the condition for persistent activity Jux = 1 (dashed blue line) and the trajectory caused by current increase (green line). (E,F) Time course of the firing rate for both cases.
Figure 5
Figure 5. Slow Dynamics on the xu Phase Plane
The x nullcline, the u nullcline, and the forbidden line (Jux = 1) are depicted in blue, red, and black, respectively. Simulated trajectories (performed in 3-D and projected onto 2-D) are in green. The attractive part of the forbidden line is shown as a dashed line, and the repulsive part as a solid line. (A) For a small input (I = 0.85 Hz), the network has three steady states; circles indicate the stable steady states, and crosses indicate the unstable ones. (B) For a high input (I = 8 Hz), the network has only one steady state. (C,D) Shaded area is the forbidden line's basin of attraction. Insets show R(t) for displayed trajectories. J is below and above J* for (C) and (D), respectively, leading to a smooth transition in (C) and a population spike in (D). In all plots, parameter set A is used (see Methods, Table 2), except for J = 6 in (C) and J = 7 in (D).
Figure 6
Figure 6. Summary of Analysis for a Single Subpopulation
Five regions in parameter space with qualitatively different network behavior are illustrated. The traces shown in blue were obtained with the following parameter sets (clockwise, beginning from Transient Response): A with J = 0.8J low, A, A with J = 1.1J*, A with J = 1.1J high, D (see Methods, Table 2).
Figure 7
Figure 7. Simulation of a Full Network
Two out of ten populations are shown while either a short or a long input of the same amplitude is delivered to the first population, (A) and (B), respectively. Each population consists of a facilitating and a depressing subpopulation, denoted by α = 1,2, respectively (see Methods). The resulting persistent state depends on the duration of the stimulus. (C,D) Response of a representative background population.

References

    1. Fuster JM, Alexander GE. Neuron activity related to short-term memory. Science. 1971;173:652–654. - PubMed
    1. Miyashita Y. Neuronal correlate of visual associative long-term memory in the primate temporal cortex. Nature. 1988;335:817–820. - PubMed
    1. Goldman-Rakic PS. Cellular basis of working memory. Neuron. 1995;14:477–485. - PubMed
    1. Miller EK, Erickson CA, Desimone R. Neural mechanisms of visual working memory in prefrontal cortex of the macaque. J Neurosci. 1996;16:5154–5167. - PMC - PubMed
    1. Amit DJ. Modelling brain function. New York: Cambridge University Press; 1989. 504

Publication types