Comparative Study
. 2007 Apr;48(4):732-42.
doi: 10.1111/j.1528-1167.2007.00988.x. Epub 2007 Feb 23.

Seizure-promoting effect of blood-brain barrier disruption

Affiliations
Comparative Study

Seizure-promoting effect of blood-brain barrier disruption

Nicola Marchi et al. Epilepsia. 2007 Apr.

Abstract

Purpose: It is generally accepted that blood-brain barrier (BBB) failure occurs as a result of CNS diseases, including epilepsy. However, evidences also suggest that BBB failure may be an etiological factor contributing to the development of seizures.

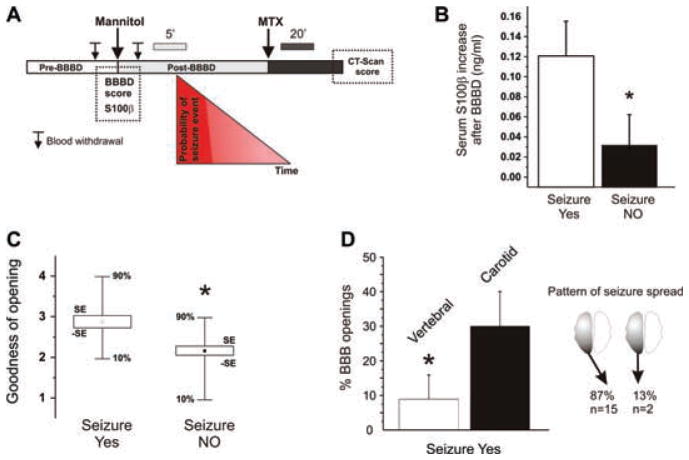
Methods: We monitored the onset of seizures in patients undergoing osmotic disruption of BBB (BBBD) followed by intraarterial chemotherapy (IAC) to treat primary brain lymphomas. Procedures were performed under barbiturate anesthesia. The effect of osmotic BBBD was also evaluated in naive pigs.

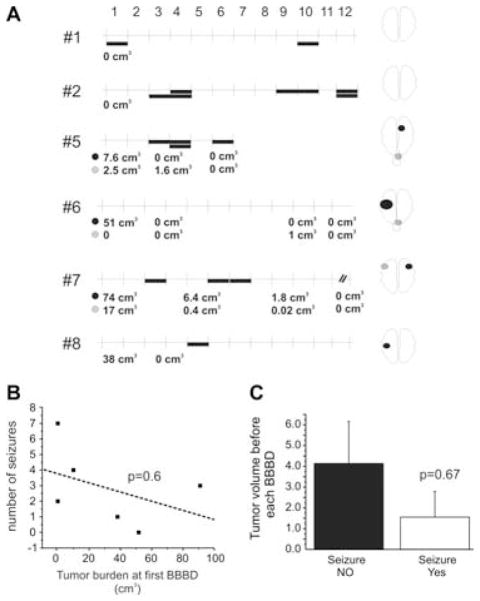
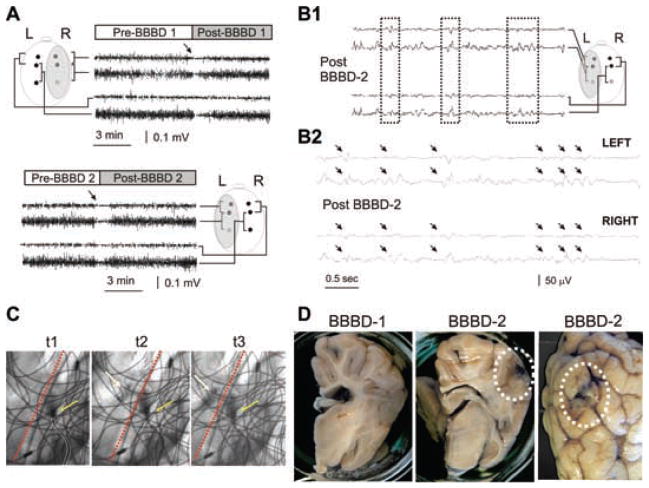
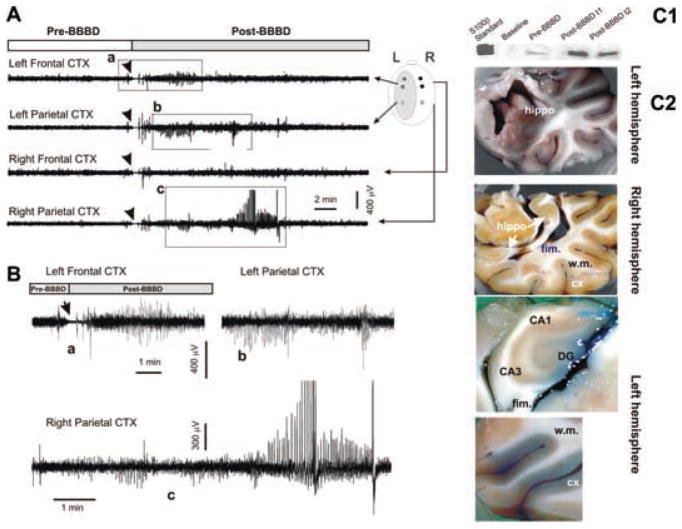
Results: Focal motor seizures occurred immediately after BBBD in 25% of procedures and originated contralateral to the hemisphere of BBBD. No seizures were observed when BBB was not breached and only IAC was administered. The only predictors of seizures were positive indices of BBBD, namely elevation of serum S100beta levels and computed tomography (CT) scans. In a porcine model of BBBD, identical procedures generated an identical result, and sudden behavioral and electrographic (EEG) seizures correlated with successful BBB disruption. The contribution of tumor or chemotherapy to acute seizures was therefore excluded.

Conclusion: This is the first study to correlate extent of acute BBB openings and development of seizures in humans and in a large animal model of BBB opening. Acute vascular failure is sufficient to cause seizures in the absence of CNS pathologies or chemotherapy.


Figures

FIG. 1
FIG. 1
(A) Diagrammatic representation of the procedure, timing of serum S100β determination, CT scans, and probability of seizure development. Note the different time scale depicted above the post-BBBD and post-MTX intervals. Seizure probability was highest (red ) during the early post-BBBD period and before MTX. Serum S100β was measured before the onset of seizures. (B) Elevation of S100β serum levels immediately after mannitol infusion was larger in patients who eventually developed seizures after blood–brain barrier disruption. The values reported are the differences between serum S100β levels in blood drawn immediately before and immediately after (up to 5′) BBBD. (See references Kapural et al., 2002; Marchi et al., 2003a for details.) Baseline serum S100β was 0.04 ± 0.01 ng/ml. Note that the postmannitol S100β values were recorded prior to any seizure onset and are thus highly unlikely to reflect consequence of motor seizures. (C) BBBD efficiency correlates with occurrence of seizures: radiological indices of BBBD obtained by CT scans after BBBD. See text for details. The asterisks indicate p < 0.02. (D) Seizure events are more common after BBB disruption in the anterior circulation and seizures induced by intracarotid mannitol manifest usually contralaterally. The data show the percentage of seizures associated with vertebral or intracarotid mannitol injections. Note that BBB disruption of the anterior circulation was more likely to result in focal motor seizures, which most commonly occurred contralateral. The asterisks indicate p < 0.05.
FIG. 2
FIG. 2
Lack of correlation between seizure occurrence (indicated by filled bars in A), tumor size or site and treatment cycle. (A) Seizure occurrence in six patients where volumetric tumor analysis was performed at each treatment episode. Each treatment refers to two subsequent BBBD at 24-h interval (see Methods). Thus, two seizure episodes may have occurred during the same treatment. The vertical lines refer to sequential treatments indicated by the numbers (1–12). The numbers at the left are patient ID’s as per Tables 1 and 2. The numbers below each graph represent the MRI volume of the tumor at the time indicated. Tumor location is schematically shown in the drawing to the right. When more than one tumor site was present, two color-coded symbols are used to match their location shown to the right with their size. (B) Lack of correlation between tumor size at beginning of first treatment and total seizure numbers during the whole treatment period. (C) Cumulative tumor burden measured in patients at time of BBBD leading to seizures or not. Tumor size does not correlate with occurrence of seizures (p = 0.6). In fact, on average, smaller tumor size was present at the time of seizure occurrence further ruling out a contribution of the tumor to epileptogenicity.
FIG. 3
FIG. 3
EEG correlates of acute blood–brain barrier disruption: a modest increase in BBB permeability does not lead to seizures. (A) Experimental setup for animal experiments. Electrodes were placed as indicated in the schematic diagram. The shaded area indicates the side of intraarterial mannitol injection. The tracings refer to frontal and parietal recordings as indicated. The upper panel refers to recordings obtained during the first BBBD attempt (BBBD1 throughout this figure), while the lower panel refers to BBBD2. Note the sudden decrease of EEG amplitude after either osmotic opening procedure. Also note the lack of obvious delayed EEG changes after BBBD1 or BBBD2. (B1) Spike-wave complexes observed after BBBD2. Note the signal reversal at different electrode locations (dashed boxes). Longer segment of recording (B2) to illustrate a cluster of spike-wave complexes seen after BBBD2 (arrows). Filters used for viewing during collection were 0.3 and 70 Hz (low pass and high pass, respectively); sampling rate was 200 Hz. (C) Indicates the site of catheterization (outlined in white) and its relationship to the midline (red dashed line). The yellow arrows indicate the extrusion of contrast agent at 1-s intervals (indicated by t 1–3). Note the slight contralateral diffusion of contrast. The wiring visible in the picture is the radiologic image of EEG electrodes and connectors. (D) Absence of Evans blue leakage after BBBD1 and minimal extravasation of the dye after BBB2. The dotted circles indicate spotty cortical leaks seen in the BBBD-2 but not BBBD-1 hemisphere. Serum S100β did not increase during these BBBD procedures (data not shown).
FIG. 4
FIG. 4
EEG correlates of acute blood–brain barrier disruption: a widespread increase in BBB permeability leads to seizures. (A) EEG recordings revealed a sharp increase in activity after BBBD in this animal. The BBBD was performed on the left hemisphere where activity was predominant. Motor seizures predominated on the right side. The traces in (B) are magnified segments as indicated by the dashed boxes in A. The arrows point to the EEG slowing that followed mannitol infusion (see also Fig. 4). Filters used for viewing during collection were 0.08 and 300 Hz (low pass and high pass, respectively); sampling rate was 1000 Hz. (C1–C2) Serum S100β increased occurred immediately post-BBBD, as assessed by western blot. Morphological demonstration of successful hemispheric blood–brain barrier disruption by Evans blue staining. Note the ubiquitous leakage in the left hemisphere and the absence of extravasation in the right. w.m: white matter; DG: dentate gyrus; fim: fimbria.
FIG. 5
FIG. 5
Histological analysis Evans blue extravasation. (A) Low-power micrographs showing the widespread leakage of the albumin-Evans blue complex (red signal) in the disrupted (BBBD) hemisphere compared to non-BBBD. The corresponding image was obtained by nuclear staining with DAPI to illustrate the relationship between serum leakage and anatomical structures. DG-dentate gyrus; s.r., stratum radiatum. (B) Higher-power images demonstrating selective leakage of the dentate gyrus in neighboring sections. (C1–C2) In the regions of Evans blue extravasation, neuronal uptake (C1) was frequently observed. Note that the “filling” of the cell extends to both basal and apical dendrites of these CA1 pyramidal cells. C2 shows vascular profiles and surrounding leakage.

References

    1. Alexander WS. Progressive fibrinoid degeneration of fibrillary astrocytes associated with mental retardation in a hydrocephalic infant. Brain. 1949;72:373–381. - PubMed
    1. Armstrong BK, Smith QR, Rapoport SI, Strohalm J, Kopacek J, Duncan R. Osmotic opening of the blood-brain barrier permeability to N-(2-hydroxypropyl) methacrylamide copolymers. Effects of polymer m.w., charge and hydrophobicity. Journal of Controlled Release. 1989;10:27–35.
    1. Clancy RR, Sharif U, Ichord R, Spray TL, Nicolson S, Tabbutt S, Wernovsky G, Gaynor JW. Electrographic neonatal seizures after infant heart surgery. Epilepsia. 2005;46:84–90. - PubMed
    1. Fazio V, Bhudia SK, Marchi N, Aumayr B, Janigro D. Peripheral detection of S100beta during cardiothoracic surgery: what are we really measuring? The Annals of Thoracic Surgery. 2004;78:46–52. - PubMed
    1. Fieschi C, Lenzi GL, Zanette E, Orzi F, Passero S. Effects on EEG of the osmotic opening of the blood-brain barrier in rats. Life Sciences. 1980;27:239–243. - PubMed

Publication types

MeSH terms