Comparative Study
. 2007 Feb 23:8:62.
doi: 10.1186/1471-2105-8-62.

Blast sampling for structural and functional analyses

Affiliations
Comparative Study

Blast sampling for structural and functional analyses

Anne Friedrich et al. BMC Bioinformatics. .

Abstract

Background: The post-genomic era is characterised by a torrent of biological information flooding the public databases. As a direct consequence, similarity searches starting with a single query sequence frequently lead to the identification of hundreds, or even thousands of potential homologues. The huge volume of data renders the subsequent structural, functional and evolutionary analyses very difficult. It is therefore essential to develop new strategies for efficient sampling of this large sequence space, in order to reduce the number of sequences to be processed. At the same time, it is important to retain the most pertinent sequences for structural and functional studies.

Results: An exhaustive analysis on a large scale test set (284 protein families) was performed to compare the efficiency of four different sampling methods aimed at selecting the most pertinent sequences. These four methods sample the proteins detected by BlastP searches and can be divided into two categories: two customisable methods where the user defines either the maximal number or the percentage of sequences to be selected; two automatic methods in which the number of sequences selected is determined by the program. We focused our analysis on the potential information content of the sampled sets of sequences using multiple alignment of complete sequences as the main validation tool. The study considered two criteria: the total number of sequences in BlastP and their associated E-values. The subsequent analyses investigated the influence of the sampling methods on the E-value distributions, the sequence coverage, the final multiple alignment quality and the active site characterisation at various residue conservation thresholds as a function of these criteria.

Conclusion: The comparative analysis of the four sampling methods allows us to propose a suitable sampling strategy that significantly reduces the number of homologous sequences required for alignment, while at the same time maintaining the relevant information concerning the active site residues.


Figures

Figure 1
Figure 1
Strategy flowchart. For each protein in the initial 284 protein dataset, the set of potential homologous sequences was detected by BlastP searches. BlastP results were then characterised according to the number of sequences detected and their associated E-value distribution. The 4 sampling methods (2 automatic methods: the mean method mm and the second derivative method sdm; 2 customisable methods: the strips method sm and the random method rm) were independently applied to the initial set and analysed in terms of reduction rate properties and sequence coverage between the methods. Finally, the 5 associated multiple alignments of complete sequences (MACS) were computed. Taking into account the common high quality MACS, the variation of the information content of the sampled sets were studied, based on the conservation of the active site residues.
Figure 2
Figure 2
Sampling methods reduction rate. Sampling methods reduction rate plotted as a function of the number of sequences detected with an E-value ≤ 0.001 by BlastP searches. A zoom on the 0 to 500 detected sequence interval is shown, with the position 130 corresponding to the number of sequences detected by BlastP searches for which the reduction rate of sm become higher than the reduction rate of mm and sdm.
Figure 3
Figure 3
BlastP E-value distribution. Graphical representation of the 10 E-clusters representing the BlastP E-value distribution. E-cluster 1 corresponds to highly populated interval 1, i.e. a majority of highly related sequences in BlastP results. E-cluster 10 corresponds to highly populated interval 10, i.e. a majority of weakly related sequences in BlastP results. N represents the number of BlastP searches in each E-cluster.
Figure 4
Figure 4
Sampling methods reduction rate as a function of the E-clusters. Sampling methods reduction rate plotted as a function of the distribution of the BlastP E-values (E-clusters). For a given E-cluster, the sizes of the black spots are proportional to the percentage of sampled BlastP at each reduction rate.
Figure 5
Figure 5
ROC curves. Based on the 192 common good quality MACS, ROC curves were constructed for the global protein set, subset-100, subset100–500 and subset+500 based on the residue conservation analysis. ROC curves are coloured according to the sampling method: in violet no sampling method, in blue mm, in orange sdm and in green sm.
Figure 6
Figure 6
Determination of the most suitable conservation threshold. ROC curves based on MACS_init residue conservation analysis for the 192 common good quality MACS: in blue for the global set, in pink for subset-100, in green for subset100–500 and in orange for subset+500. The tested thresholds are represented by: × 100%; ■ 95%; ○ 90%; formula image 85%; formula image 80%; formula image 75%; formula image 70%; ● 65%; □ 60%.
Figure 7
Figure 7
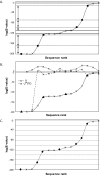
Sequence selection according to the sampling method algorithms. Sequences detected by BlastP searches are represented according to the logarithm of their E-value on the graphs (×) and sequences selected by each method are represented by ■ for mm, ▲ for sdm and ◆ for sm. (a) mm selection: differences between the logarithms of 2 successive E-values greater than the computed threshold are represented by a bidirectional arrow; (b) sdm selection: V is the computed E-value variation function. Sequences corresponding to V inflexion points are selected; (c) sm selection: the logarithmic curve of the BlastP E-values is cut in x strips (x = 10 on the graph) of equal width. Inside each non empty strip, the sequence associated to the smallest E-value is selected. mm, sdm and sm systematically select the first sequence detected by BlastP search.
Figure 8
Figure 8
Sampled distant sequences. The graph represents sequences collected by BlastP searches according to the logarithm of their E-values. Sequences selected by sampling are marked with a square. When more then 500 sequences are highlighted, the first 500 sequences are aligned in MACS_init. Sampled Distant Sequences (SDS) indicate sequences with an E-value > 0.001 and ranking after the 500 first sequences in BlastP results, selected by any sampling method.

Similar articles

Cited by

References

    1. Boguski MS, Lowe TM, Tolstoshev CM. dbEST--database for "expressed sequence tags". Nat Genet. 1993;4:332–333. doi: 10.1038/ng0893-332. - DOI - PubMed
    1. Bernal A, Ear U, Kyrpides N. Genomes OnLine Database (GOLD): a monitor of genome projects world-wide. Nucleic Acids Res. 2001;29:126–127. doi: 10.1093/nar/29.1.126. - DOI - PMC - PubMed
    1. Genome OnLine Database http://www.genomesonline.org/
    1. Altschul SF, Gish W, Miller W, Myers EW, Lipman DJ. Basic local alignment search tool. J Mol Biol. 1990;215:403–410. - PubMed
    1. Lecompte O, Thompson JD, Plewniak F, Thierry J, Poch O. Multiple alignment of complete sequences (MACS) in the post-genomic era. Gene. 2001;270:17–30. doi: 10.1016/S0378-1119(01)00461-9. - DOI - PubMed

Publication types