. 2007 Sep;44(9):905-19.
doi: 10.1016/j.fgb.2007.01.004. Epub 2007 Jan 10.

Pneumocystis murina MSG gene family and the structure of the locus associated with its transcription

Affiliations

Pneumocystis murina MSG gene family and the structure of the locus associated with its transcription

Scott P Keely et al. Fungal Genet Biol. 2007 Sep.

Abstract

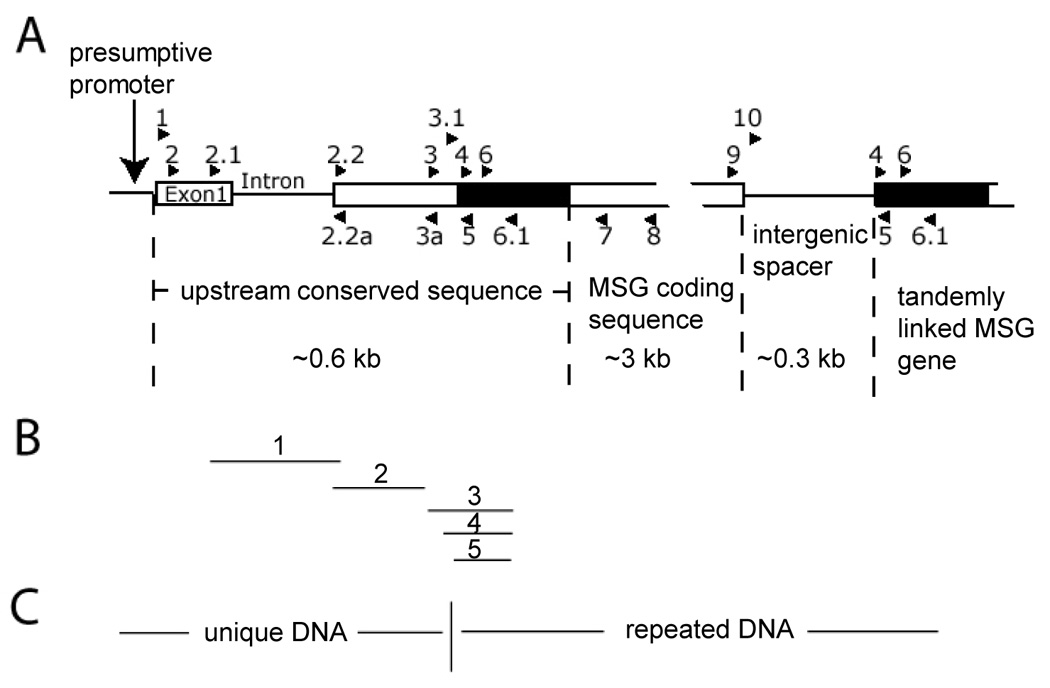
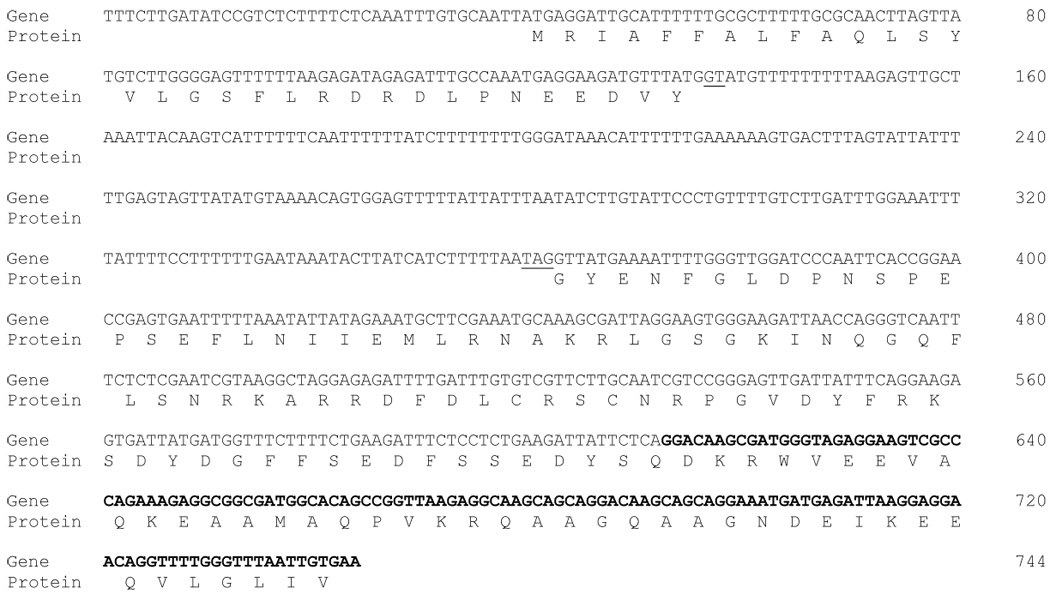
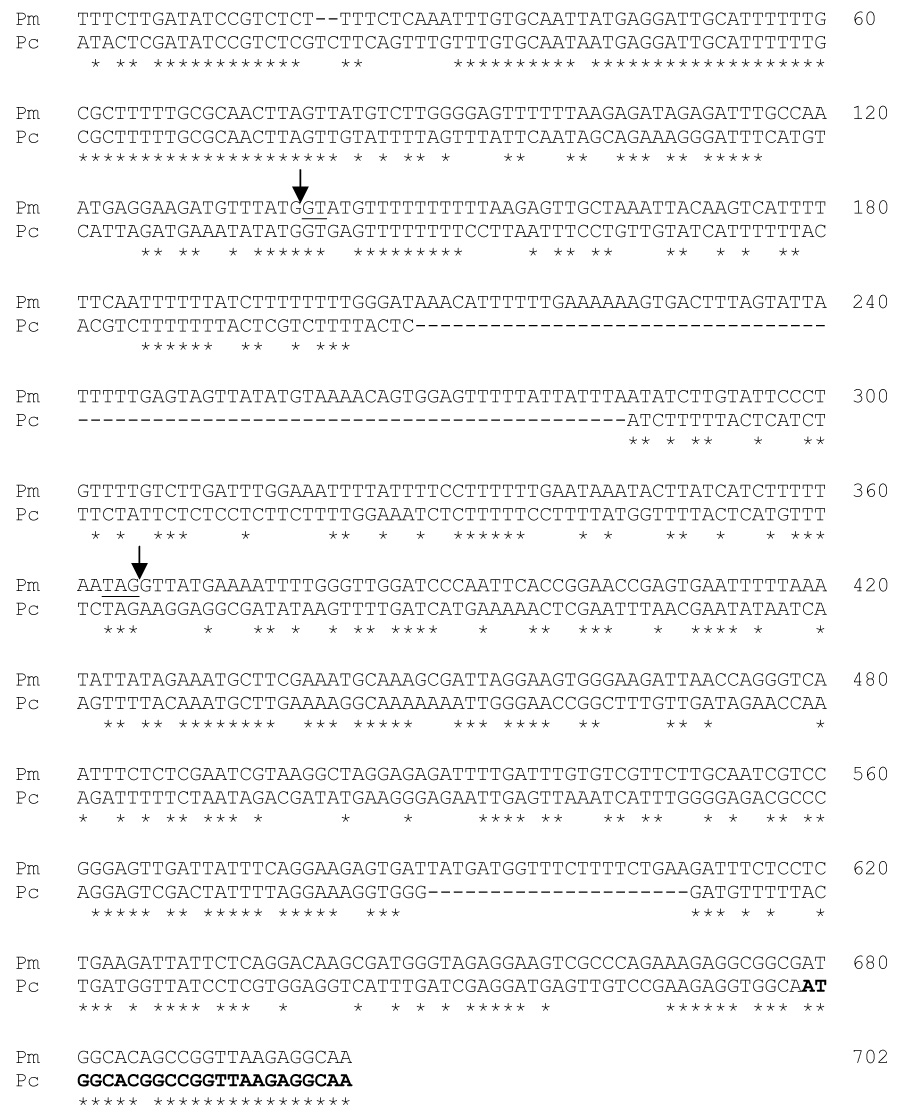
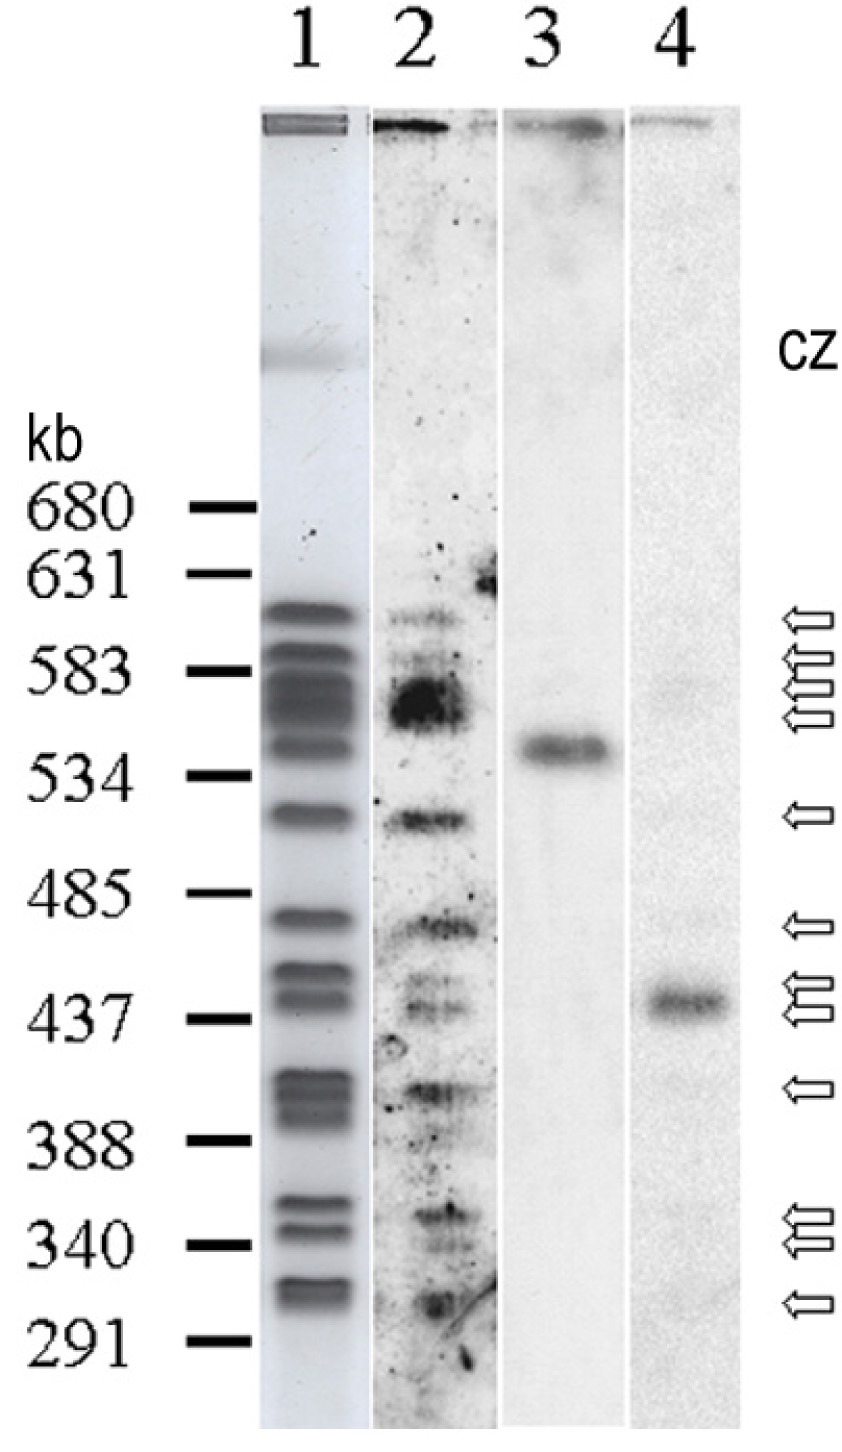
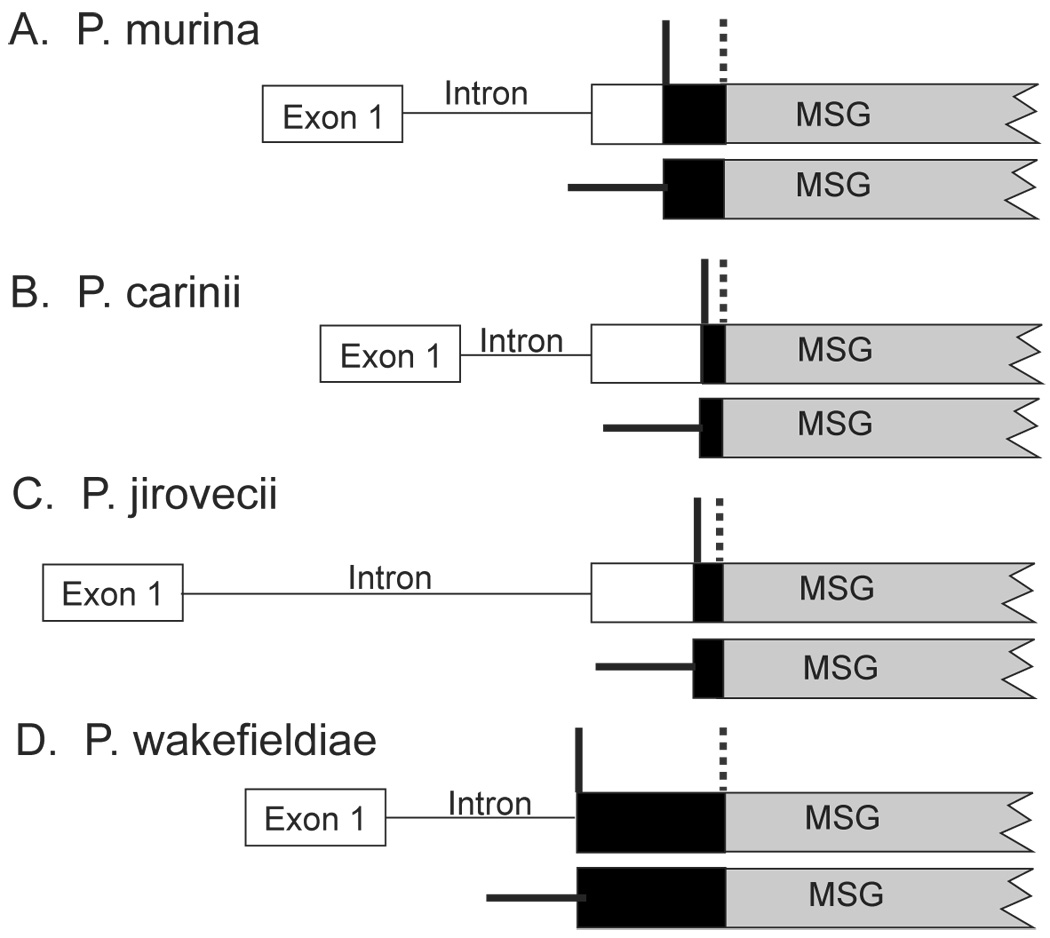
Analysis of the Pneumocystis murina MSG gene family and expression-site locus showed that, as in Pneumocystis carinii, P. murina MSG genes are arranged in head-to-tail tandem arrays located on multiple chromosomes, and that a variety of MSG genes can reside at the unique P. murina expression site. Located between the P. murina expression site and attached MSG gene is a block of 132 basepairs that is also present at the beginning of MSG genes that are not at the expression site. The center of this sequence block resembles the 28 basepair CRJE of P. carinii, but the block of conserved sequence in P. murina is nearly five times longer than in P. carinii, and much shorter than in P. wakefieldiae. These data indicate that the P. murina expression-site locus has a distinct structure.


Figures

Figure 1
Figure 1. Map of the P. murina expression-site locus
A) The map was constructed primarily from information obtained in the studies presented herein. The map begins upstream of the sequence analyzed. Presumably, there is a promoter of transcription located in this region. Exon 1 marks the beginning of the sequence that encodes the Upstream Conserved Sequence (UCS), which is the sequence found at the beginning of messenger RNAs encoding diverse MSGs. DNA encoding the UCS extends from exon 1, which is unique in the genome, through the intron into a second block of unique coding DNA. This block of unique DNA (exon 1-intron-beginning of exon 2) constitutes the expression site. Adjacent to the expression site is a block of non-unique DNA called the CRJE (see Table 1), which is represented by a black rectangle. The 3-prime end of the UCS coincides with the 3-prime end of the CRJE. Other copies of the CRJE are located at the beginning of MSG genes not at the expression site. Hence the beginning of the UCS is encoded by unique DNA, and the end is encoded repeated DNA. The sequence encoding the UCS is followed by a sequence encoding an MSG protein. Two tandem MSG-encoding sequences are shown. The first is directly attached to the expression site; the second lies downstream of the first, and is separated from the UCS-linked MSG gene by approximately 300 bp (intergenic spacer). It should be noted that while tandem gene pairs are demonstrated by the data presented herein, it is not yet known if a tandem gene pair exists at the expression site. Locations and names of PCR primers are indicated by numbered arrowheads. See Table 2 for primer sequences and locations. B) The five numbered lines mark regions studied by real-time PCR. C) The region to the left of the line contains a DNA sequence that is present only once in the haploid genome of P. murina. The region to the right of the line contains a DNA sequence that is present in multiple copies in the genome.
Figure 2
Figure 2. Sequence at the P. murina expression-site locus
The DNA sequence shown encodes the conserved RNA sequence found at the beginning of messenger RNA molecules that encode different MSG proteins. The sequence begins in a region of exon 1 that is transcribed but presumably untranslated and ends at the end of the CRJE. The gap in the protein sequence marks the intron. Canonical splice acceptor and donor sequences are underlined. Nucleotides in bold print constitute the CRJE. Numbers at the right end of each line of nucleotide sequence indicate the cumulative number of nucleotides in the sequence to that point.
Figure 3
Figure 3. Comparison of expression site loci in P. murina and P. carinii
Pm and Pc indicate sequences from P. murina and P. carinii, respectively. The P. carinii sequence is from accession no. D82031. Canonical splice acceptor and donor sequences are underlined and splice points marked by arrows. Asterisks indicate positions where the two sequences match. The alignment ends at the end of the P. carinii CRJE, which is indicated by nucleotides in bold print. Numbers at the right indicate the cumulative number of sites in the alignment to that point.
Figure 4
Figure 4. Hybridization mapped the sequence encoding UCS to a single P. murina chromosome
Lane 1: Negative image of Sybr-gold stained chromosomes resolved by CHEF. Lanes 2–4, autoradiograms showing chromosomes that hybridized to probes for MSG, kex1 and UCS, respectively. Numbers to the left of lane 1 indicate locations of markers ranging from 291 to 680 kilobasepairs (markers not shown). Open arrows to the right of lane 4 indicate chromosome bands scored as positive for the MSG probe. CZ indicates the compression zone, where DNA from the mouse host lung is located (visible in lane 1).
Figure 5
Figure 5. Quantitative real-time PCR of the MSG expression site
A) Examples of scatter plot data from plasmids used to establish the relationship between target copy-number (DNA copy number) and PCR cycles required to obtain detectable amplicons (threshold cycle number). Boxes are data points obtained using primers p3 and p6.1. Triangles are data points obtained using primers p4 and p6.1. B) Calculated copy-numbers of five UCS regions compared to the number of P. carinii nuclei present in each PCR. The bar labelled “nuclei” indicates the number of P. murina nuclei added to each reaction. Nuclei were counted twice and the line at the top of the bar indicates the standard deviation. Regions 1, 2, 3, 4 and 5 (see Figure 1B), were amplified with primers p2.1 plus p2.2a, p2.2 plus p3a, p3 plus p6.1, and p3.1 plus p6.1, and p4 plus p6.1, respectively. Three independent PCR reactions were performed with a given primer pair. Lines at the tops of bars indicate standard deviations.
Figure 6
Figure 6. Comparison of expression-site to sequences (ES) upstream of MSG genes not at the expression site
The top line of sequence is from the expression site. The second line is the consensus sequence derived from regions upstream of 11 MSG genes that are not at the expression site. The dash indicates a gap in the sequence alignment. The third and fourth lines show sequence polymorphisms in the regions upstream of MSG gene that are not at the expression site. The locations of the sequences that bind PCR primers p3.1, p4, p5 and p6.1 are shown by arrows. The 24 bases underlined contain 2 copies of a 12 base repeat. A third copy of this repeat was present in some sequences.
Figure 7
Figure 7. Neighbor-joining tree of MSG sequences
Branch lengths are drawn to scale. Sequences less than 1% diverged were placed on the same branch. The scale at the bottom shows branch lengths corresponding to pairwise p-distance values calculated by dividing the number of mismatched bases by the total number compared.
Figure 8
Figure 8. Comparison of expression sites in four Pneumocystis species
For each species, two maps are shown. The upper map depicts the expresson site and the beginning of an expression-site-linked MSG gene. The lower map depicts an MSG gene not linked to the expression site. The symbol │ indicates the boundary between unique and repeated DNA at the expression site. The region to the left of the line contains DNA that is present only once in the haploid genome of P. murina. The region to the right of the line contains DNA that is a member of a family of sequences located throughout the genome. The symbol marks the boundary between the UCS and MSG sequences. The black boxes represent CRJEs, defined as the 5-prime sequence that is conserved among all members of the MSG gene family in a given species.

Similar articles

Cited by

References

    1. An CL, Gigliotti F, Harmsen AG. Exposure of immunocompetent adult mice to Pneumocystis carinii f. sp. muris by cohousing: growth of P. carinii f. sp. muris and host immune response. Infect. Immun. 2003;71:2065–2070. - PMC - PubMed
    1. Andrews TD, Gojobori T. Strong positive selection and recombination drive the antigenic variation of the PilE protein of the human pathogen Neisseria meningitidis. Genetics. 2004;166:25–32. - PMC - PubMed
    1. Angus CW, Tu A, Vogel P, Qin M, Kovacs JA. Expression of variants of the major surface glycoprotein of Pneumocystis carinii. J. Exp. Med. 1996;183:1229–1234. - PMC - PubMed
    1. Armstrong MY, Cushion MT. Animal Models. In: Walzer PD, editor. Pneumocystis carinii pneumonia. 2nd. New York: Marcel Dekker; 1994. pp. 181–222.
    1. Bishop R, Gurnell J, Laakkonen J, Whitwell K, Peters S. Detection of Pneumocystis DNA in the lungs of several species of wild mammal. J. Eukaryot. Microbiol. 1997;44:57S. - PubMed

Publication types

LinkOut - more resources