. 2007 Feb 27;49(8):909-16.
doi: 10.1016/j.jacc.2006.07.074. Epub 2007 Feb 9.

Transmural dispersion of myofiber mechanics: implications for electrical heterogeneity in vivo

Affiliations

Transmural dispersion of myofiber mechanics: implications for electrical heterogeneity in vivo

Hiroshi Ashikaga et al. J Am Coll Cardiol. .

Abstract

Objectives: We investigated whether transmural mechanics could yield insight into the transmural electrical sequence.

Background: Although the concept of transmural dispersion of repolarization has helped explain a variety of arrhythmias, its presence in vivo is still disputable.

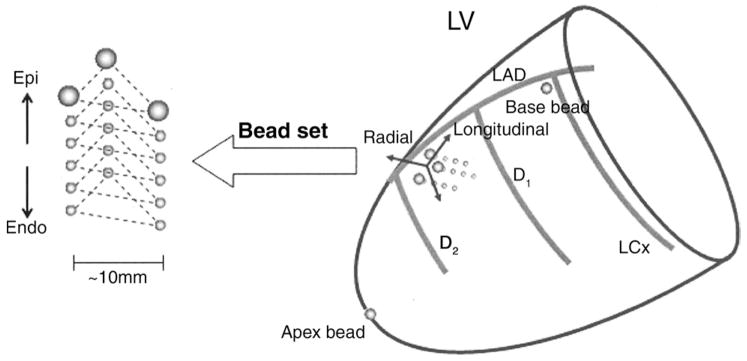
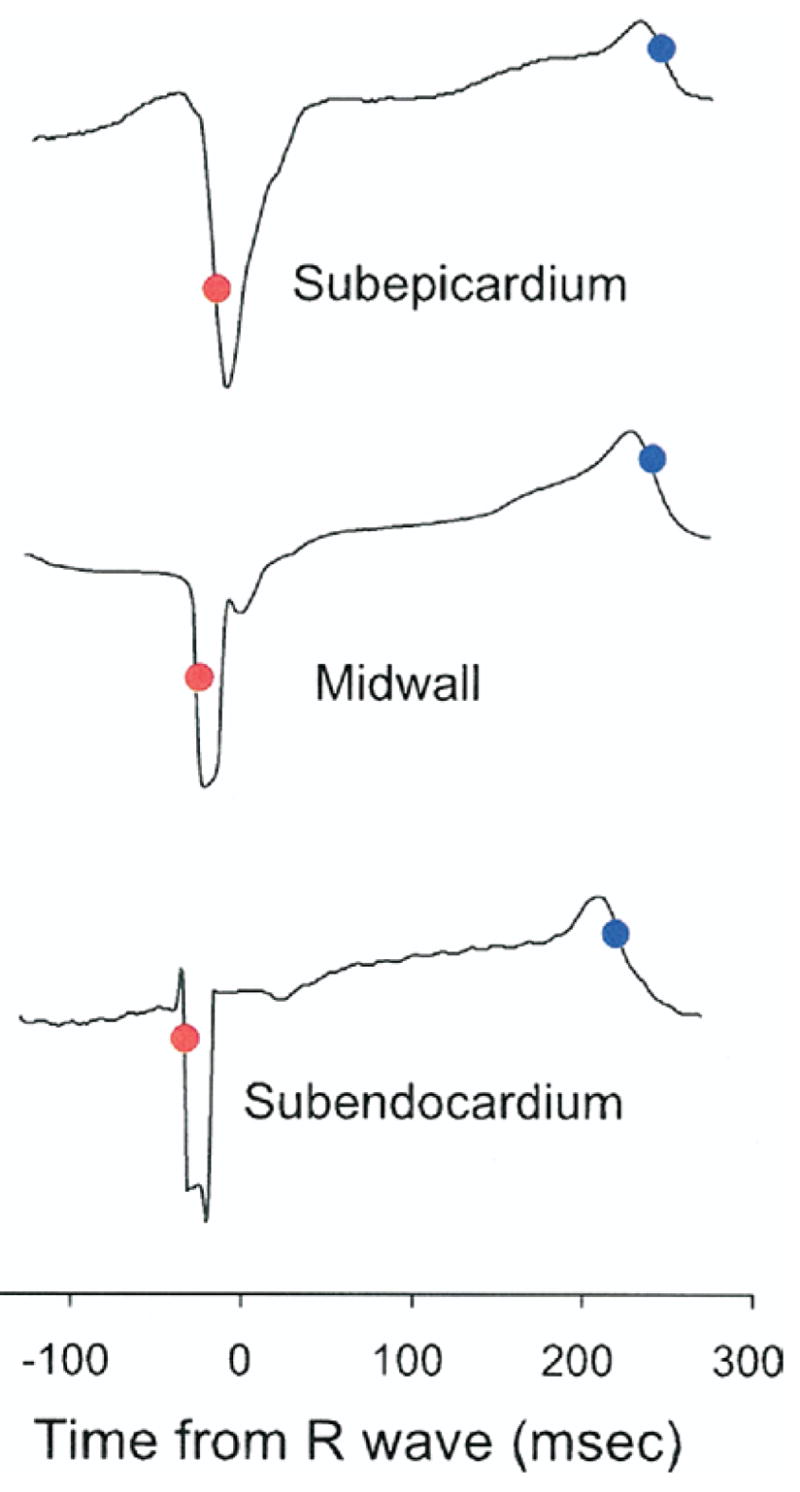
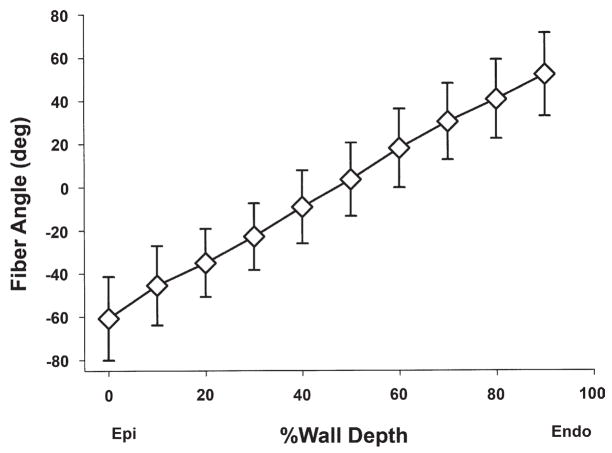
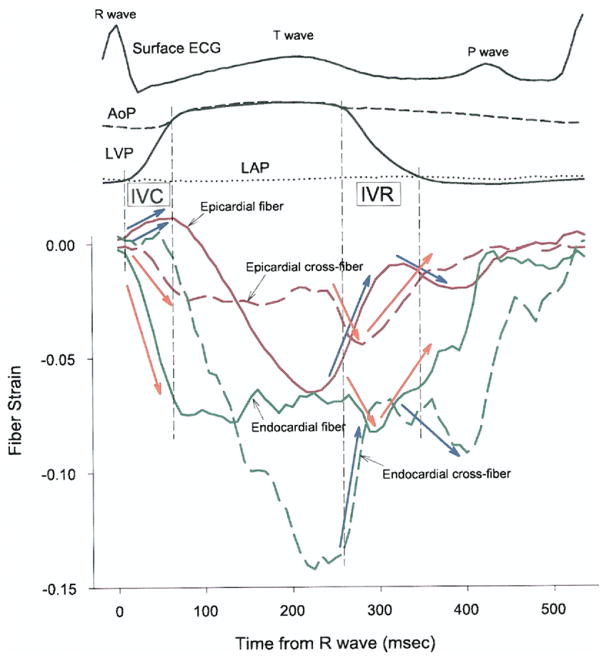
Methods: We studied the time course of transmural myofiber mechanics in the anterior left ventricle of normal canines in vivo (n = 14) using transmural bead markers under biplane cineradiography. In 4 of these animals, plunge electrodes were placed in the myocardial tissue within the bead set to measure transmural electrical sequence.

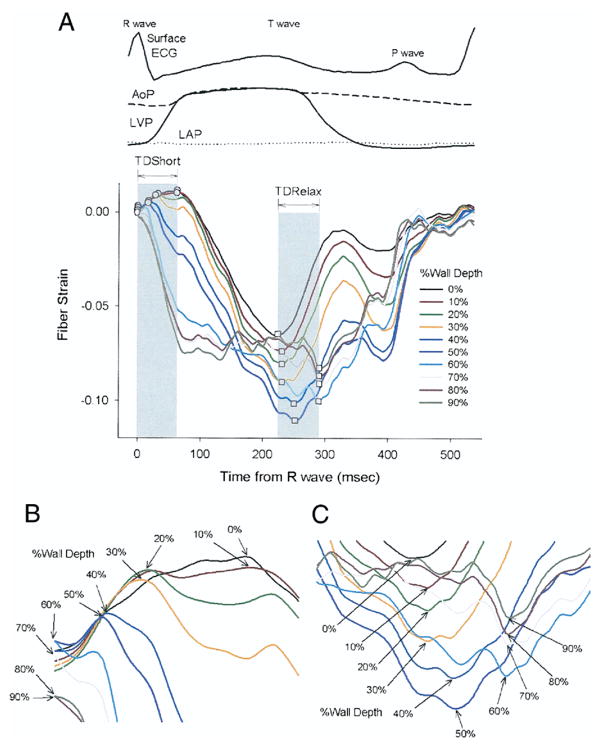
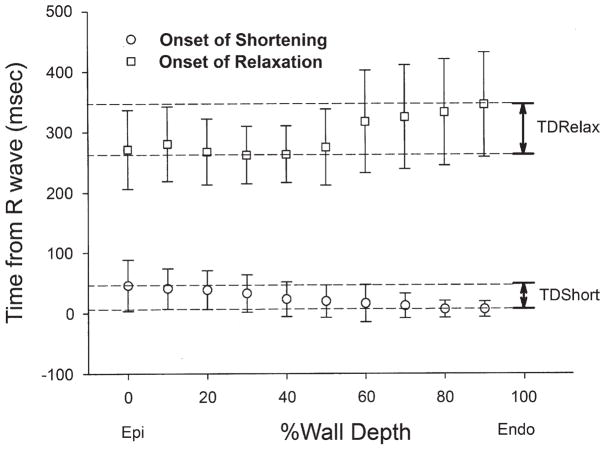
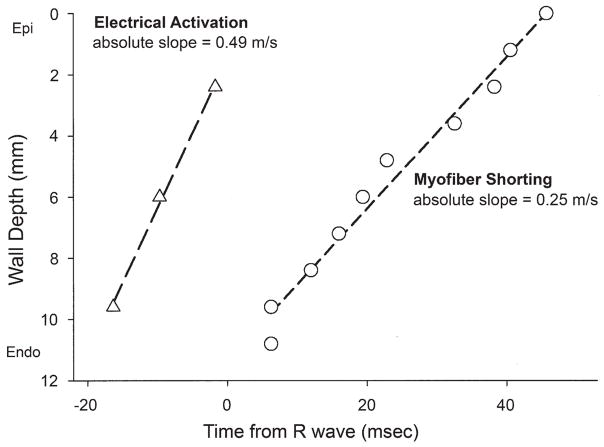
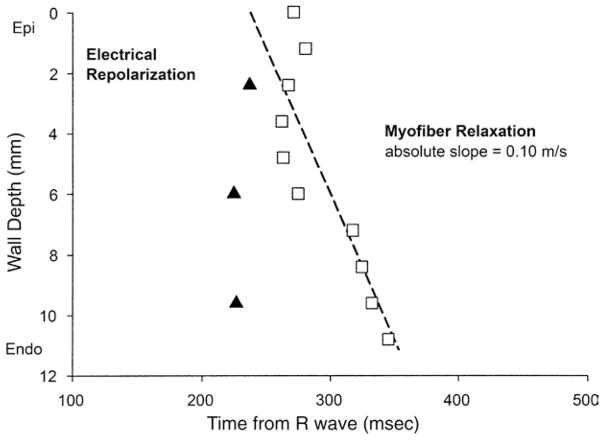
Results: The onset of myofiber shortening was earliest at endocardial layers and progressively delayed toward epicardial layers (p < 0.001), resulting in transmural dispersion of myofiber shortening of 39 ms. The onset of myofiber relaxation was earliest at epicardial layers and most delayed at subendocardial layers (p = 0.004), resulting in transmural dispersion of myofiber relaxation of 83 ms. There was no significant transmural gradient in electrical repolarization (p = NS).

Conclusions: Despite lack of evidence of significant transmural gradient in electrical repolarization in vivo, there is transmural dispersion of myofiber relaxation as well as shortening.


Figures

Figure 1
Figure 1. Schematic Representation of the Heart
The transmural bead set was implanted between the first (D1) and the second (D2) diagonal branch of the left anterior descending coronary artery (LAD) to measure finite deformation of the myocardial tissue across the wall. Endo = endocardium; Epi = epicardium; LCx = left circumflex coronary artery; LV = left ventricle.
Figure 2
Figure 2. Bipolar Electrograms From Plunge Electrodes
Red and blue dots mark the time points of steepest portion of initial bipolar QRS waveforms and end of the T wave, respectively. Note the endocardial-to-epicardial direction of depolarization, whereas no clear transmural dispersion of repolarization is observed.
Figure 3
Figure 3. Transmural Fiber Orientation
Values are mean ± SD (n = 14). Fiber angles were measured with reference to the positive circumferential direction. Abbreviations as in Figure 1.
Figure 4
Figure 4. Time Course of Transmural Fiber Strains
(A) Entire cardiac cycle. Different colors represent the percent wall depth from the epicardial surface. Open circles = onset of myofiber shortening; open squares = onset of myofiber relaxation. (B) A closer look at TDShort. (C) A closer look at TDRelax. AoP = central aortic pressure; ECG = electrocardiogram; LAP = left atrial pressure; LVP = left ventricular pressure; TDRelax = transmural dispersion of myofiber relaxation; TDShort = transmural dispersion of myofiber shortening.
Figure 5
Figure 5. Transmural Dispersion of Myofiber Mechanics
Values are mean and error bars indicate SD (n = 14). Open circles = onset of myofiber shortening; open squares = onset of myofiber relaxation. Endo = endocardium; Epi = epicardium; TDRelax = transmural dispersion of myofiber relaxation; TDShort = transmural dispersion of myofiber shortening.
Figure 6
Figure 6. Electrical Activation and the Onset of Myofiber Shortening Versus Mean Wall Depth
Open triangles = electrical activation (n = 4) mean value at each depth (mm); open circles = onset of myofiber shortening (n = 14) mean value at each depth (mm). Abbreviations as in Figure 1.
Figure 7
Figure 7. Electrical Repolarization and the Onset of Myofiber Relaxation Versus Mean Wall Depth
Closed triangles = electrical repolarization (n = 4) mean value at each depth (mm); open squares = onset of myofiber shortening (n = 14) mean value at each depth (mm). Abbreviations as in Figure 1.
Figure 8
Figure 8. Transmural Tissue Coupling
Red and green lines = strains in epicardial (0% wall depth) and endocardial (90% wall depth) layers, respectively. Solid and broken lines = fiber and cross-fiber strains, respectively. AoP = central aortic pressure; ECG = electrocardiogram; IVC = isovolumic contraction; IVR = isovolumic relaxation; LAP = left atrial pressure; LVP = left ventricular pressure.

Comment in

  • Of that Waltz in my heart.
    Narula J, Vannan MA, DeMaria AN. Narula J, et al. J Am Coll Cardiol. 2007 Feb 27;49(8):917-20. doi: 10.1016/j.jacc.2006.12.006. Epub 2007 Feb 9. J Am Coll Cardiol. 2007. PMID: 17320751 No abstract available.
  • On the mechanisms of transmural dispersion of myocardial mechanics.
    Karagueuzian HS. Karagueuzian HS. J Am Coll Cardiol. 2007 Aug 14;50(7):649-50; author reply 650. doi: 10.1016/j.jacc.2007.03.061. Epub 2007 Jul 30. J Am Coll Cardiol. 2007. PMID: 17692752 No abstract available.

Similar articles

Cited by

References

    1. Antzelevitch C. Cardiac repolarization. The long and short of it Europace. 2005;7(Suppl 2):3–9. - PMC - PubMed
    1. Antzelevitch C, Fish J. Electrical heterogeneity within the ventricular wall. Basic Res Cardiol. 2001;96:517–27. - PubMed
    1. Sicouri S, Antzelevitch C. A subpopulation of cells with unique electrophysiological properties in the deep subepicardium of the canine ventricle. The M cell Circ Res. 1991;68:1729–41. - PubMed
    1. Antzelevitch C, Shimizu W, Yan GX, et al. The M cell: its contribution to the ECG and to normal and abnormal electrical function of the heart. J Cardiovasc Electrophysiol. 1999;10:1124–52. - PubMed
    1. Yan GX, Antzelevitch C. Cellular basis for the normal T wave and the electrocardiographic manifestations of the long-QT syndrome. Circulation. 1998;98:1928–36. - PubMed

Publication types