

Differential regulation of the high affinity choline transporter and the cholinergic locus by cAMP signaling pathways
- PMID: 17320829
- PMCID: PMC1911187
- DOI: 10.1016/j.brainres.2007.01.119
Differential regulation of the high affinity choline transporter and the cholinergic locus by cAMP signaling pathways
Abstract
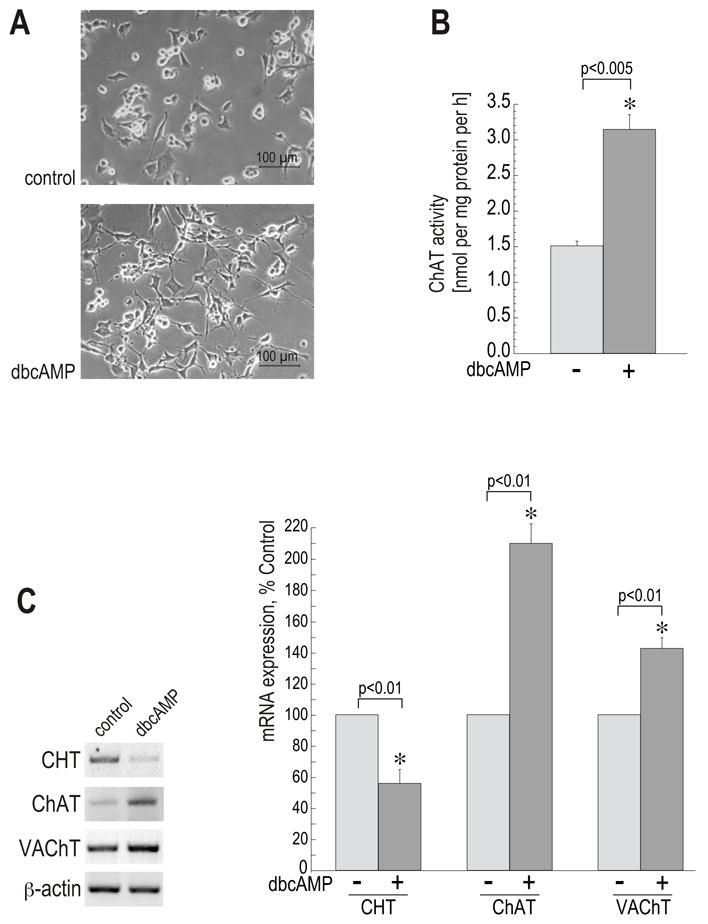
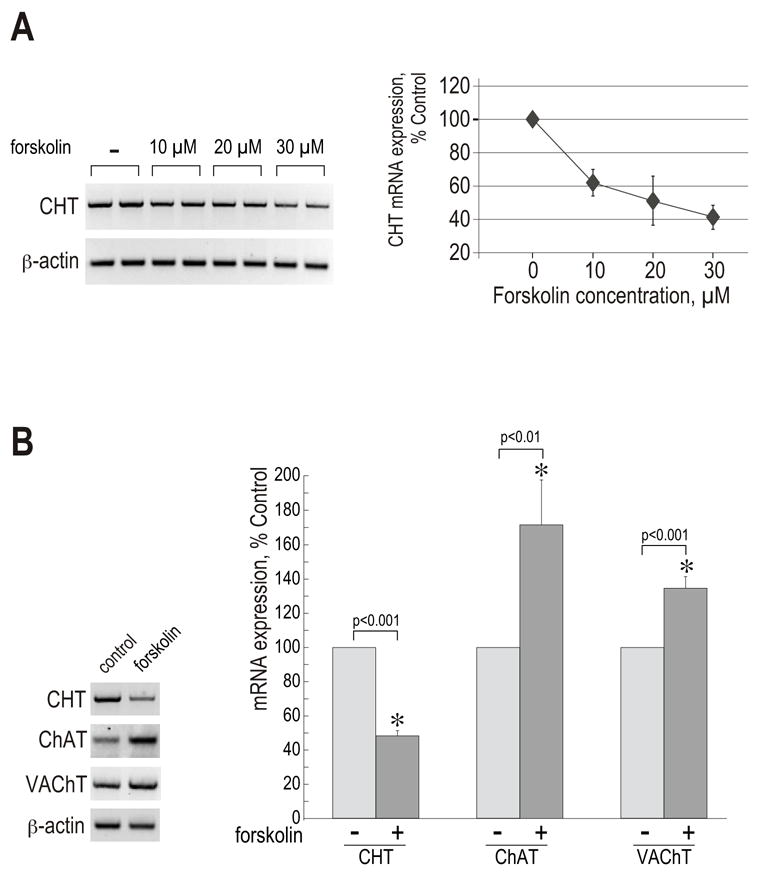
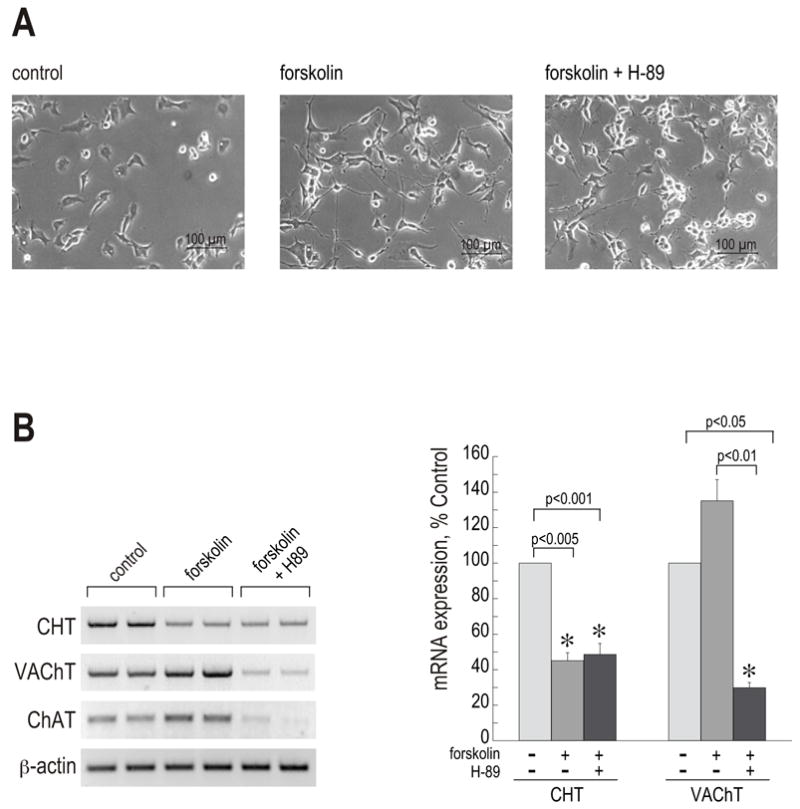
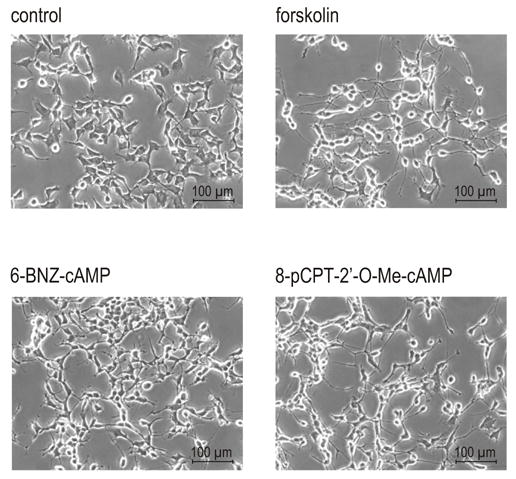
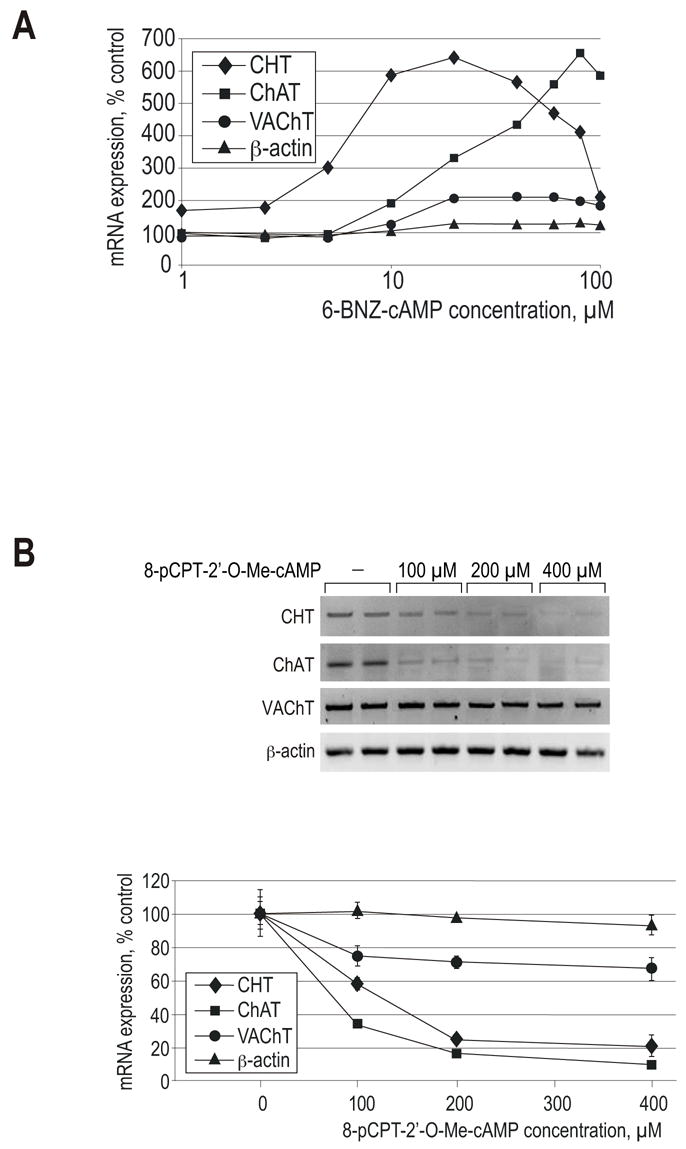
Synthesis, storage and release of acetylcholine (ACh) require the expression of several specialized enzymes, including choline acetyltransferase (ChAT), vesicular acetylcholine transporter (VAChT) and the high-affinity choline transporter (CHT). Extracellular factors that regulate CHT expression and their signaling pathways remain poorly characterized. Using the NSC-19 cholinergic cell line, derived from embryonic spinal cord, we compared the effects of the second messenger cAMP on the expression of CHT and the cholinergic locus containing the ChAT and VAChT genes. Treatment of NSC-19 cells with dbcAMP and forskolin, thus increasing intracellular cAMP levels, significantly reduced CHT mRNA expression, while it upregulated ChAT/VAChT mRNA levels and ChAT activity. The cAMP-induced CHT downregulation was independent of PKA activity, as shown in treatments with the PKA inhibitor H-89. The alternative Epac-Rap pathway, when stimulated by a specific Epac activator, led to significant downregulation of CHT and ChAT, and, to a lesser extent, VAChT. In contrast, the PKA activator 6-BNZ-cAMP stimulated the expression of all three genes, but with varying concentration-dependence profiles. Our results indicate that elevations of intraneuronal cAMP concentration have differential effects on the cholinergic phenotype, depending on the involvement of different downstream effectors. Interestingly, although CHT is expressed predominantly in cholinergic cells, its regulation appears to be distinct from that of the cholinergic locus.
Figures
Similar articles
-
Expression of high affinity choline transporter during mouse development in vivo and its upregulation by NGF and BMP-4 in vitro.Brain Res Dev Brain Res. 2005 Jun 30;157(2):132-40. doi: 10.1016/j.devbrainres.2005.03.013. Brain Res Dev Brain Res. 2005. PMID: 15885806
-
Exploring the regulation of the expression of ChAT and VAChT genes in NG108-15 cells: implication of PKA and PI3K signaling pathways.Neurochem Res. 2003 Apr;28(3-4):557-64. doi: 10.1023/a:1022829608540. Neurochem Res. 2003. PMID: 12675145
-
The cholinergic gene locus is coordinately regulated by protein kinase A II in PC12 cells.J Neurochem. 1998 Sep;71(3):1118-26. doi: 10.1046/j.1471-4159.1998.71031118.x. J Neurochem. 1998. PMID: 9721736
-
From the cholinergic gene locus to the cholinergic neuron.J Physiol Paris. 1998 Oct-Dec;92(5-6):385-8. doi: 10.1016/S0928-4257(99)80010-2. J Physiol Paris. 1998. PMID: 9789842 Review.
-
The high-affinity choline transporter: a critical protein for sustaining cholinergic signaling as revealed in studies of genetically altered mice.Handb Exp Pharmacol. 2006;(175):525-44. doi: 10.1007/3-540-29784-7_21. Handb Exp Pharmacol. 2006. PMID: 16722248 Review.
Cited by
-
Substrate-induced internalization of the high-affinity choline transporter.J Neurosci. 2011 Oct 19;31(42):14989-97. doi: 10.1523/JNEUROSCI.2983-11.2011. J Neurosci. 2011. PMID: 22016532 Free PMC article.
-
Epac and PKA: a tale of two intracellular cAMP receptors.Acta Biochim Biophys Sin (Shanghai). 2008 Jul;40(7):651-62. doi: 10.1111/j.1745-7270.2008.00438.x. Acta Biochim Biophys Sin (Shanghai). 2008. PMID: 18604457 Free PMC article. Review.
-
Non-neuronal cholinergic machinery present in cardiomyocytes offsets hypertrophic signals.J Mol Cell Cardiol. 2012 Aug;53(2):206-16. doi: 10.1016/j.yjmcc.2012.05.003. Epub 2012 May 14. J Mol Cell Cardiol. 2012. PMID: 22587993 Free PMC article.
-
Nerve growth factor regulates the expression of the cholinergic locus and the high-affinity choline transporter via the Akt/PKB signaling pathway.J Neurochem. 2008 Dec;107(5):1284-93. doi: 10.1111/j.1471-4159.2008.05681.x. Epub 2008 Sep 13. J Neurochem. 2008. PMID: 18793330 Free PMC article.
-
Acetyl-CoA the key factor for survival or death of cholinergic neurons in course of neurodegenerative diseases.Neurochem Res. 2013 Aug;38(8):1523-42. doi: 10.1007/s11064-013-1060-x. Epub 2013 May 16. Neurochem Res. 2013. PMID: 23677775 Free PMC article. Review.
References
-
- Apparsundaram S, Ferguson SM, Blakely RD. Molecular cloning and characterization of a murine hemicholinium-3-sensitive choline transporter. Biochem Soc Trans. 2001;29:711–6. - PubMed
-
- Apparsundaram S, Ferguson SM, George AL, Jr, Blakely RD. Molecular cloning of a human, hemicholinium-3-sensitive choline transporter. Biochem Biophys Res Commun. 2000;276:862–7. - PubMed
-
- Berse B, Blusztajn JK. Coordinated up-regulation of choline acetyltransferase and vesicular acetylcholine transporter gene expression by the retinoic acid receptor alpha, cAMP, and leukemia inhibitory factor/ciliary neurotrophic factor signaling pathways in a murine septal cell line. J Biol Chem. 1995;270:22101–4. - PubMed
-
- Berse B, Szczecinska W, Lopez-Coviella I, Madziar B, Zemelko V, Kaminski R, Kozar K, Lips KS, Pfeil U, Blusztajn JK. Expression of high affinity choline transporter during mouse development in vivo and its upregulation by NGF and BMP-4 in vitro. Brain Res Dev Brain Res. 2005;157:132–40. - PubMed
-
- Blusztajn JK. Choline, a vital amine. Science. 1998;281:794–5. - PubMed
Publication types
MeSH terms
Substances
Grants and funding
LinkOut - more resources
Full Text Sources
Other Literature Sources
Molecular Biology Databases
