. 2007 Feb 23;315(5815):1137-40.
doi: 10.1126/science.1138050.

Redirection of silencing targets by adenosine-to-inosine editing of miRNAs

Affiliations

Redirection of silencing targets by adenosine-to-inosine editing of miRNAs

Yukio Kawahara et al. Science. .

Abstract

Primary transcripts of certain microRNA (miRNA) genes are subject to RNA editing that converts adenosine to inosine. However, the importance of miRNA editing remains largely undetermined. Here we report that tissue-specific adenosine-to-inosine editing of miR-376 cluster transcripts leads to predominant expression of edited miR-376 isoform RNAs. One highly edited site is positioned in the middle of the 5'-proximal half "seed" region critical for the hybridization of miRNAs to targets. We provide evidence that the edited miR-376 RNA silences specifically a different set of genes. Repression of phosphoribosyl pyrophosphate synthetase 1, a target of the edited miR-376 RNA and an enzyme involved in the uric-acid synthesis pathway, contributes to tight and tissue-specific regulation of uric-acid levels, revealing a previously unknown role for RNA editing in miRNA-mediated gene silencing.


Figures
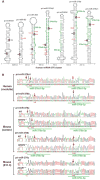
Fig. 1
Fig. 1
A → I RNA editing of pri–miR-376 RNAs. (A) Hairpin structures of six human pri–miR-376 RNAs are shown. Editing sites (red A's) are numbered with the 5′ end of the human miR-376a1-5p sequence counted as +1. Regions processed into mature miRNAs are highlighted in green. The two most highly edited A's (+4 and +44 sites, red As) are highlighted in black. The genomically encoded G at +4 is also highlighted in black. The genomic distance between miRNA genes is indicated by the numbers at the bottom. (B) Analysis of pri–miR-376a1 and pri–miR-376b RNAs in human and mouse brains (wild-type and ADAR2−/−) and pri–miR-376c RNAs in mouse E11.5 embryos (wild-type and ADAR1−/−) by sequencing of reverse transcription polymerase chain reaction (RT-PCR) products. Thus, an A → I RNA editing site is detected as an A → G change in the cDNA sequencing chromatogram. Editing of human pri–miR-376b at the +44 site is almost 100%, as seen by the presence of a sole G peak without an A peak. Editing sites are indicated by red arrows.
Fig. 2
Fig. 2
Characterization of edited pri– and mature miR-376 RNAs in various tissues. (A) Editing frequency of pri– and mature miR-376a RNAs (5p strand) at the +4 site from various human and mouse tissues. (B) Editing frequency of pri– and mature miR-376a-c and miR-368 RNAs (3p strand) at the +44 site from subregions of human and mouse brains. The human mature miR-376a1-3p, miR-376a2-3p, and miR-376b-3p are not distinguishable in our assay, so the observed editing frequency represents the average of these three isoforms. [(A) and (B)] The editing frequency of pri-miRNAs is the ratio of the G peak over the sum of the G and A peaks of the sequencing chromatogram of RT-PCR products. Two separate measurements resulted in identical values. The editing frequency of mature miRNAs is a ratio of the cDNA clones containing the A → G change over the total cDNA clones examined (>50 isolates).
Fig. 3
Fig. 3
Physiological effects of miR-376a RNA editing. (A) Confirmation of the edited miR-376a targets. Relative luciferase activities in HeLa cells cotransfected with unedited miR-376a-5p (black bars) and edited miR-376a-5p (A → G at the +4 site) (blue bars), respectively. Reciprocal experiments were also conducted; for example, miR-376a-5p edited-version target sites challenged by unedited miR-376a and vice versa. (B) Luciferase activities were examined in HeLa cells cotransfected with a negative control cel-miR-67 (gray bars) and edited miR-376a-5p (A → I at the +4 site) (red bars), respectively. [(A) and (B)] The luciferase activities were compared statistically by Mann-Whitney U tests. Significant differences are indicated by asterisks, P < 0.05. Error bars, SEM (n = 3, where n is the number of independent measurements taken). (C) Western blot analysis of TTK and PRPS1 expression levels in the wild-type and ADAR2−/− mouse cortex and liver. Significant differences are indicated by asterisks, P < 0.05. Error bars, SEM (n = 3). (D) Uric-acid levels in the wild-type and ADAR2−/− mouse cortex and liver. Significant difference is indicated by an asterisk, P < 0.01. Error bars, SEM (n = 6).

References

    1. Bartel DP. Cell. 2004;116:281. - PubMed
    1. Du T, Zamore PD. Development. 2005;132:4645. - PubMed
    1. Hammond SM. Curr Opin Genet Dev. 2006;16:4. - PubMed
    1. He L, Hannon GJ. Nat Rev Genet. 2004;5:522. - PubMed
    1. Kim VN. Nat Rev Mol Cell Biol. 2005;6:376. - PubMed

Publication types

MeSH terms