

Analysis of temporal gene expression during Bacillus subtilis spore germination and outgrowth
- PMID: 17322312
- PMCID: PMC1855883
- DOI: 10.1128/JB.01736-06
Analysis of temporal gene expression during Bacillus subtilis spore germination and outgrowth
Abstract
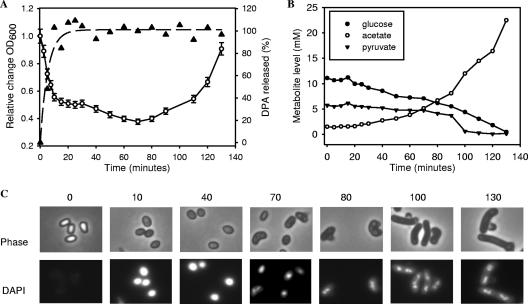
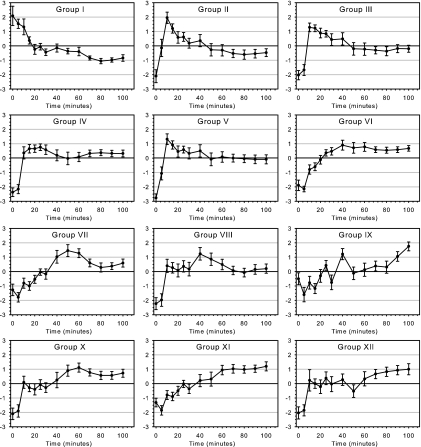
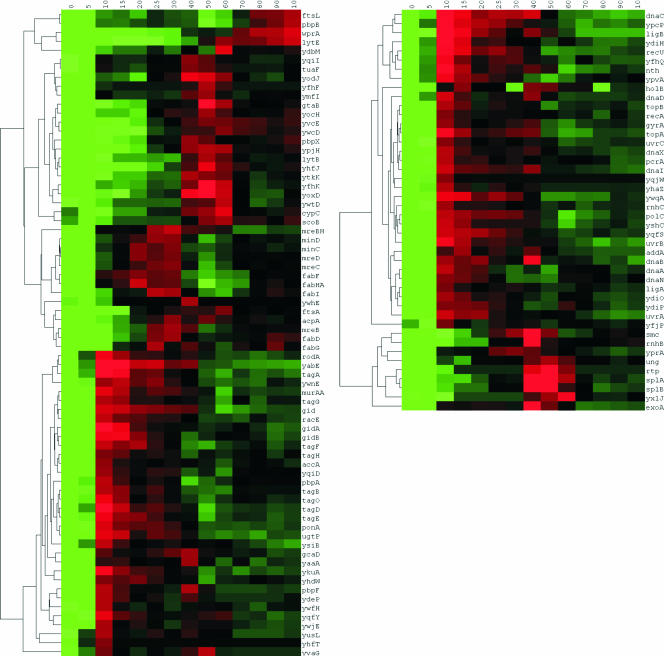
Bacillus subtilis forms dormant spores upon nutrient depletion. Under favorable environmental conditions, the spore breaks its dormancy and resumes growth in a process called spore germination and outgrowth. To elucidate the physiological processes that occur during the transition of the dormant spore to an actively growing vegetative cell, we studied this process in a time-dependent manner by a combination of microscopy, analysis of extracellular metabolites, and a genome-wide analysis of transcription. The results indicate the presence of abundant levels of late sporulation transcripts in dormant spores. In addition, the results suggest the existence of a complex and well-regulated spore outgrowth program, involving the temporal expression of at least 30% of the B. subtilis genome.
Figures


Similar articles
-
Mechanism of the hydrolysis of 4-methylumbelliferyl-beta-D-glucoside by germinating and outgrowing spores of Bacillus species.J Appl Microbiol. 2004;96(6):1245-55. doi: 10.1111/j.1365-2672.2004.02263.x. J Appl Microbiol. 2004. PMID: 15139916
-
Sporulation-specific expression of the yvgW (cadA) gene and the effect of blockage on spore properties in Bacillus subtilis.Gene. 2006 Nov 1;382:71-8. doi: 10.1016/j.gene.2006.06.014. Epub 2006 Jul 5. Gene. 2006. PMID: 16901659
-
Cannibalism by sporulating bacteria.Science. 2003 Jul 25;301(5632):510-3. doi: 10.1126/science.1086462. Epub 2003 Jun 19. Science. 2003. PMID: 12817086
-
Dependent sequences of gene expression controlling spore formation in Bacillus subtilis.Microbiol Sci. 1987 Aug;4(8):238-44. Microbiol Sci. 1987. PMID: 3155276 Review.
-
Sporulation of Bacillus subtilis.Curr Opin Microbiol. 2004 Dec;7(6):579-86. doi: 10.1016/j.mib.2004.10.001. Curr Opin Microbiol. 2004. PMID: 15556029 Review.
Cited by
-
Phosphoproteome dynamics mediate revival of bacterial spores.BMC Biol. 2015 Sep 17;13:76. doi: 10.1186/s12915-015-0184-7. BMC Biol. 2015. PMID: 26381121 Free PMC article.
-
Identification of CdnL, a Putative Transcriptional Regulator Involved in Repair and Outgrowth of Heat-Damaged Bacillus cereus Spores.PLoS One. 2016 Feb 5;11(2):e0148670. doi: 10.1371/journal.pone.0148670. eCollection 2016. PLoS One. 2016. PMID: 26849219 Free PMC article.
-
Germination and Outgrowth of Bacillus subtilis Spores Deficient in BER and DisA Unveil Alternative Genetic Checkpoints.Microorganisms. 2025 Apr 18;13(4):939. doi: 10.3390/microorganisms13040939. Microorganisms. 2025. PMID: 40284773 Free PMC article.
-
Live cell imaging of germination and outgrowth of individual bacillus subtilis spores; the effect of heat stress quantitatively analyzed with SporeTracker.PLoS One. 2013;8(3):e58972. doi: 10.1371/journal.pone.0058972. Epub 2013 Mar 25. PLoS One. 2013. PMID: 23536843 Free PMC article.
-
Observations on research with spores of Bacillales and Clostridiales species.J Appl Microbiol. 2019 Feb;126(2):348-358. doi: 10.1111/jam.14067. Epub 2018 Sep 27. J Appl Microbiol. 2019. PMID: 30106202 Free PMC article. Review.
References
-
- Ashburner, M., C. A. Ball, J. A. Blake, D. Botstein, H. Butler, J. M. Cherry, A. P. Davis, K. Dolinski, S. S. Dwight, J. T. Eppig, M. A. Harris, D. P. Hill, L. Issel-Tarver, A. Kasarskis, S. Lewis, J. C. Matese, J. E. Richardson, M. Ringwald, G. M. Rubin, G. Sherlock, et al. 2000. Gene ontology: tool for the unification of biology. Nat. Genet. 25:25-29. - PMC - PubMed
-
- Blencke, H. M., G. Homuth, H. Ludwig, U. Mader, M. Hecker, and J. Stulke. 2003. Transcriptional profiling of gene expression in response to glucose in Bacillus subtilis: regulation of the central metabolic pathways. Metab. Eng. 5:133-149. - PubMed
Publication types
MeSH terms
Substances
Associated data
- Actions
LinkOut - more resources
Full Text Sources
Molecular Biology Databases
