. 2007 Apr;143(4):1789-801.
doi: 10.1104/pp.106.093971. Epub 2007 Feb 23.

WRKY75 transcription factor is a modulator of phosphate acquisition and root development in Arabidopsis

Affiliations

WRKY75 transcription factor is a modulator of phosphate acquisition and root development in Arabidopsis

Ballachanda N Devaiah et al. Plant Physiol. 2007 Apr.

Abstract

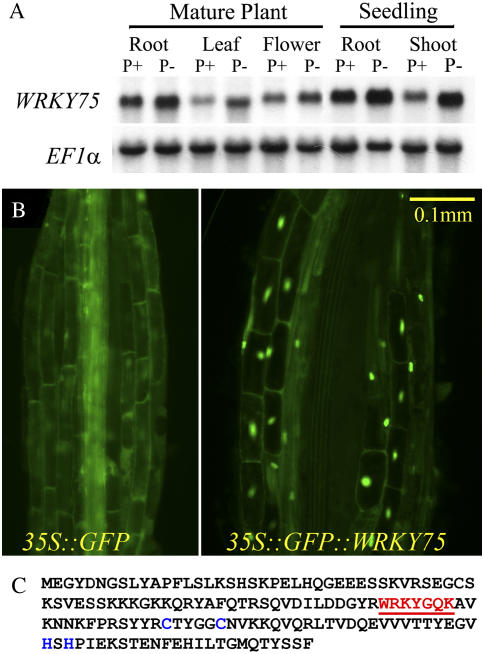
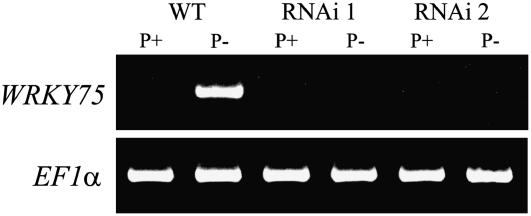
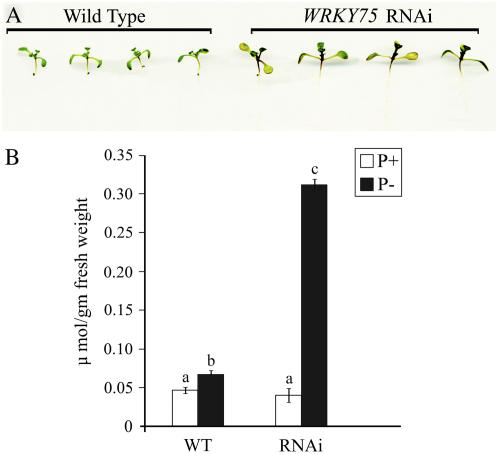
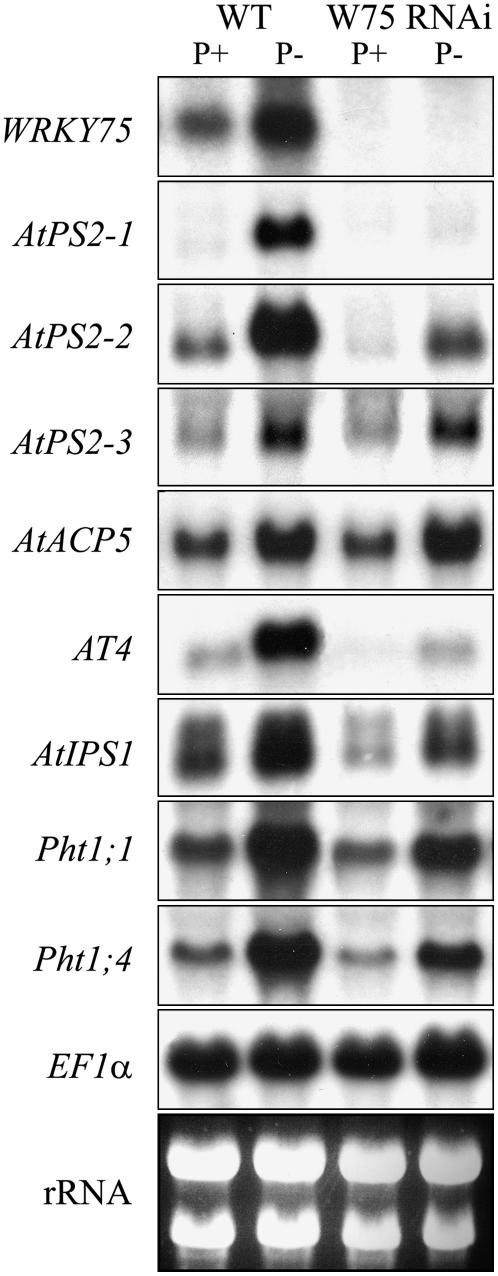
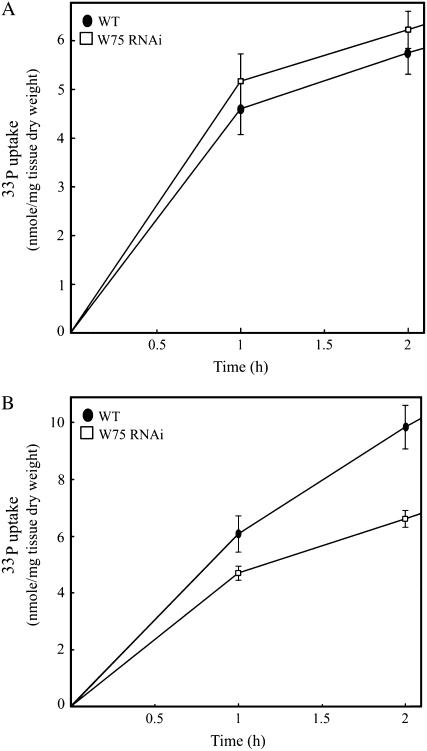
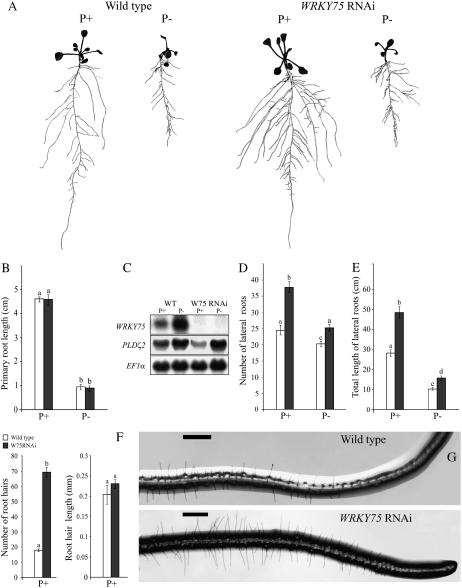
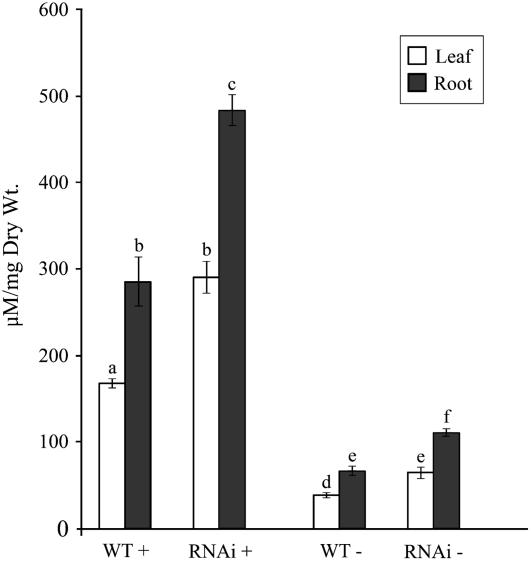
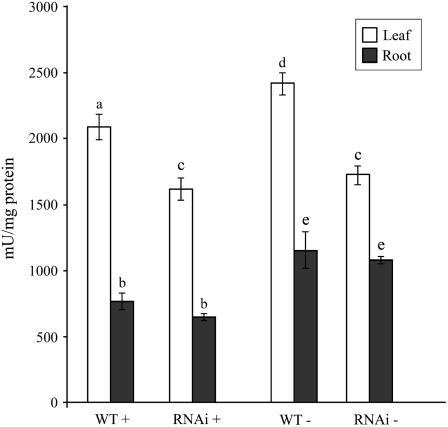
Phosphate (Pi) deficiency limits plant growth and development, resulting in adaptive stress responses. Among the molecular determinants of Pi stress responses, transcription factors play a critical role in regulating adaptive mechanisms. WRKY75 is one of several transcription factors induced during Pi deprivation. In this study, we evaluated the role of the WRKY75 transcription factor in regulating Pi starvation responses in Arabidopsis (Arabidopsis thaliana). WRKY75 was found to be nuclear localized and induced differentially in the plant during Pi deficiency. Suppression of WRKY75 expression through RNAi silencing resulted in early accumulation of anthocyanin, indicating that the RNAi plants were more susceptible to Pi stress. Further analysis revealed that the expression of several genes involved in Pi starvation responses, including phosphatases, Mt4/TPS1-like genes, and high-affinity Pi transporters, was decreased when WRKY75 was suppressed. Consequently, Pi uptake of the mutant plant was also decreased during Pi starvation. In addition, when WRKY75 expression was suppressed, lateral root length and number, as well as root hair number, were significantly increased. However, changes in the root architecture were obvious under both Pi-sufficient and Pi-deficient conditions. This indicates that the regulatory effect of WRKY75 on root architecture could be independent of the Pi status of the plant. Together, these results suggest that WRKY75 is a modulator of Pi starvation responses as well as root development. WRKY75 is the first member of the WRKY transcription factor family reported to be involved in regulating a nutrient starvation response and root development.


Figures

Figure 1.
Figure 1.
WRKY75 expression during Pi deprivation and its subcellular localization. A, RNA-blot analysis of WRKY75 gene expression. Arabidopsis plants were grown either hydroponically or in liquid culture conditions for 7 d and then transferred to medium containing Pi (P+) or lacking Pi (P−), where they were grown for an additional 7 d. Roots, rosette leaves, and flowers were collected from mature plants grown hydroponically, whereas roots and shoots were collected from young seedlings grown in liquid culture. Ten micrograms of total RNA from these samples was separated electrophoretically and blotted onto a nylon membrane that was then probed with a 32P-labeled WRKY75 cDNA. The membrane was subsequently stripped and rehybridized with an elongation factor (EF1α) gene probe used as a loading control. B, Subcellular localization of a GFP∷WRKY75 fusion protein. Microscopic images of root cells from Arabidopsis plants transformed with a control gene, 35SGFP (left), or a 35SGFPWRKY75 fusion gene (right). C, Amino acid sequence of WRKY75 showing the highly conserved WRKY domain WRKYGQK and the novel C2H2 zinc finger motif in red and blue letters, respectively.
Figure 2.
Figure 2.
RT-PCR analysis of WRKY75 RNAi plants. Semiquantitative RT-PCR was performed using RNA extracted from wild type (WT) and two independent RNAi lines grown in liquid culture for 7 d under Pi-sufficient (P+) and Pi-deficient (P−) conditions. Gene-specific primers were used for WRKY75 cDNA. EF1α was used as a constitutive control gene. The figure indicates the product from 25 PCR cycles.
Figure 3.
Figure 3.
Anthocyanin accumulation in WRKY75 RNAi plants during Pi deprivation. Seven-day-old seedlings of wild-type and WRKY75 RNAi plants grown on half-strength MS medium were transferred into MS medium in petri dishes with Pi (1 mm) or without Pi (P−). Images and anthocyanin content were recorded on the third day of treatment. A, The seedlings grown in P− conditions were scanned at 600 dpi, showing the early accumulation of anthocyanin in the hypocotyl and cotyledonary leaves of the WRKY75 RNAi plants as compared to the wild type (WT). The samples are representative of 15 seedlings of each genotype. B, Anthocyanin content was determined in wild-type and WRKY75 RNAi plants grown with Pi and without Pi on the third day of Pi starvation. Values are mean ± se (n = 5), and different letters above the bars indicate that the means are statistically different (P < 0.05). [See online article for color version of this figure.]
Figure 4.
Figure 4.
RNA-blot analysis showing the effect of WRKY75 RNAi knockdown on the expression of Pi starvation-responsive genes. Wild-type (WT) and WRKY75 RNAi (W75 RNAi) plants grown in liquid culture under Pi-sufficient (P+) and Pi-deficient (P−) conditions for 7 d were used for RNA extraction. Total RNA (15 μg) was electrophoretically separated, blotted onto a nylon membrane, and hybridized with a 32P-labeled WRKY75 probe. The membrane was stripped and subsequently rehybridized with probes corresponding to the following genes consecutively: AtPS2-1, AtPS2-2, AtPS2-3, AtACP5, At4, AtIPS1, Pht1;1, and Pht1;4. EF1α was used as the loading control. Ethidium bromide-stained rRNA prior to blotting demonstrates the RNA integrity.
Figure 5.
Figure 5.
Decreased Pi uptake in WRKY75 RNAi plants during Pi starvation. Wild-type plants (black circles) and WRKY75 RNAi plants (white squares) were grown on 0.5× MS medium for 7 d and then transferred as groups of 10 seedlings into Pi-sufficient or Pi-deficient medium for 3 d. The Pi uptake of these 10-d-old seedlings was monitored over a 2-h period. A, Pi uptake in plants from Pi-sufficient conditions. B, Pi uptake in plants from Pi-deficient conditions. Error bars represent se (n = 3).
Figure 6.
Figure 6.
Root architecture of WRKY75 RNAi plants. Wild-type and WRKY75 RNAi plants were grown under Pi-sufficient (P+) and Pi-deficient (P−) conditions for 7 d on vertically oriented petri plates. A, Lateral roots were spread to reveal the architectural details and scanned at 600 dpi. The seedlings shown are representative of 20 seedlings of the wild type and WRKY75 RNAi mutants grown under P+ and P− conditions. B, D, E, and F show comparative histograms of wild-type (white bars) and WRKY75 RNAi plants (black bars) with regard to various components of their root architecture under P+ or P− conditions. Different letters on the bars represent means that are statistically different (P < 0.02). Values are means ± se (n = 16) of each genotype per treatment. B, Primary root length. C, RNA-blot analysis showing the effect of WRKY75 RNAi knockdown on the expression of PLDζ2. Total RNA (15 μg) from wild-type (WT) and WRKY75 RNAi (W75 RNAi) plants grown under P+ and P− conditions was electrophoretically separated and blotted onto a nylon membrane. The membrane was initially hybridized with a 32P-labeled WRKY75 probe and later rehybridized with a probe for PLDζ2. EF1α was used as the loading control. D, Total length of all first-order lateral roots per plant. E, Total number of lateral roots per plant. F, Root hair length and number of root hair under P+ conditions. The data were recorded in an area spanning 5 mm from the root tip. Values are means ± se (n = 5) per genotype. G, Microscopic images of root tips with intact root hair from plants grown under P+ conditions. The scale bars in the panels represent 0.5 mm.
Figure 7.
Figure 7.
Increased total P concentration in WRKY75 RNAi plants. Pi concentration in leaves (white bars) and roots (black bars) of wild-type and WRKY75 RNAi plants grown hydroponically with Pi (P+: 250 μm) and without Pi (P−) for 7 d. Error bars indicate se (n = 4), and different letters above the bars represent means that are statistically different (P < 0.05).
Figure 8.
Figure 8.
Decreased phosphatase activity in WRKY75 RNAi plants. Total acid phosphatase activity in leaves (white bars) and roots (black bars) of wild-type and WRKY75 RNAi plants grown hydroponically with Pi (P+: 250 μm) and without Pi (P−) for 7 d. Error bars indicate se (n = 4), and different letters above the bars represent means that are statistically different (P < 0.05).

References

    1. Abel S, Ticconi AC, Delatorre CA (2002) Phosphate sensing in higher plants. Physiol Plant 115 1–8 - PubMed
    1. Abramoff MD, Magelhaes PJ, Ram SJ (2004) Image processing with ImageJ. Biophotonics International 11 36–42
    1. Ascencio J (1994) Acid phosphatase as a diagnostic tool. Commun Soil Sci Plant Anal 25 1553–1564
    1. Baldwin JC, Karthikeyan AS, Raghothama KG (2001) LEPS2, a phosphorus starvation-induced novel acid phosphatase from tomato. Plant Physiol 125 728–737 - PMC - PubMed
    1. Bari R, Pant BD, Stitt M, Scheible W-R (2006) PHO2, microRNA399, and PHR1 define a phosphate-signaling pathway in plants. Plant Physiol 141 988–999 - PMC - PubMed

Publication types