. 2007 Mar;170(3):843-54.
doi: 10.2353/ajpath.2007.051213.

Essential roles of the CC chemokine ligand 3-CC chemokine receptor 5 axis in bleomycin-induced pulmonary fibrosis through regulation of macrophage and fibrocyte infiltration

Affiliations

Essential roles of the CC chemokine ligand 3-CC chemokine receptor 5 axis in bleomycin-induced pulmonary fibrosis through regulation of macrophage and fibrocyte infiltration

Yuko Ishida et al. Am J Pathol. 2007 Mar.

Abstract

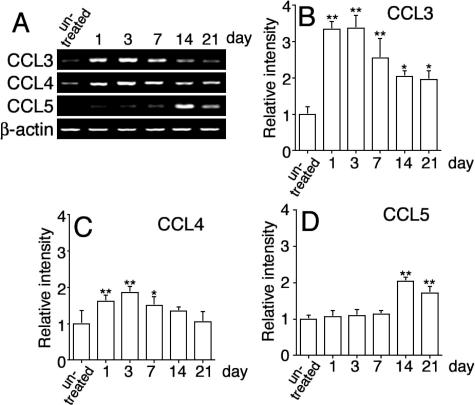
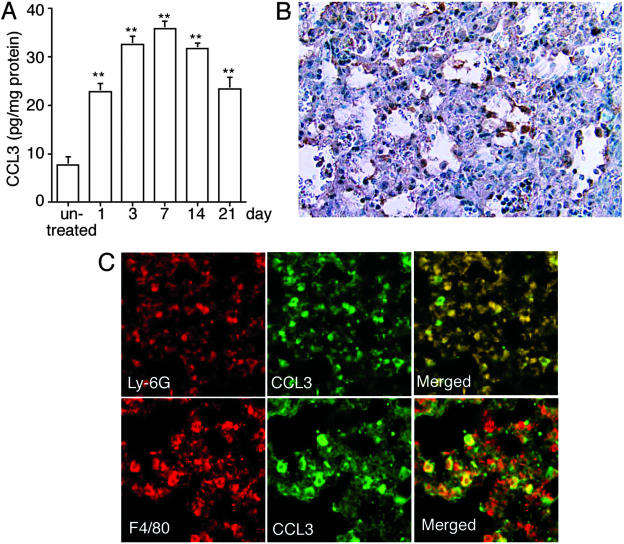
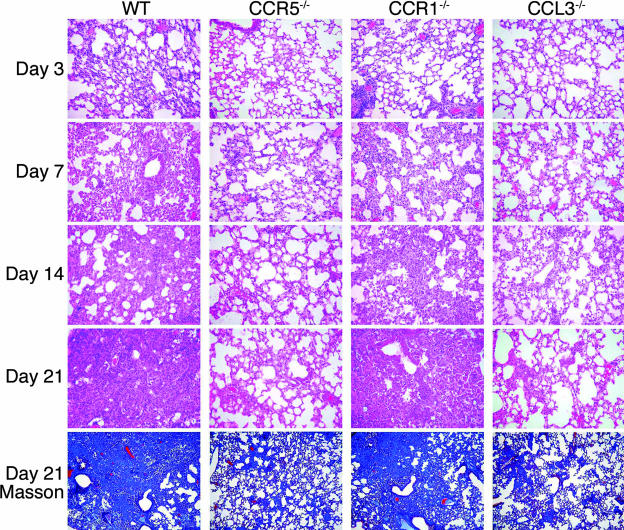
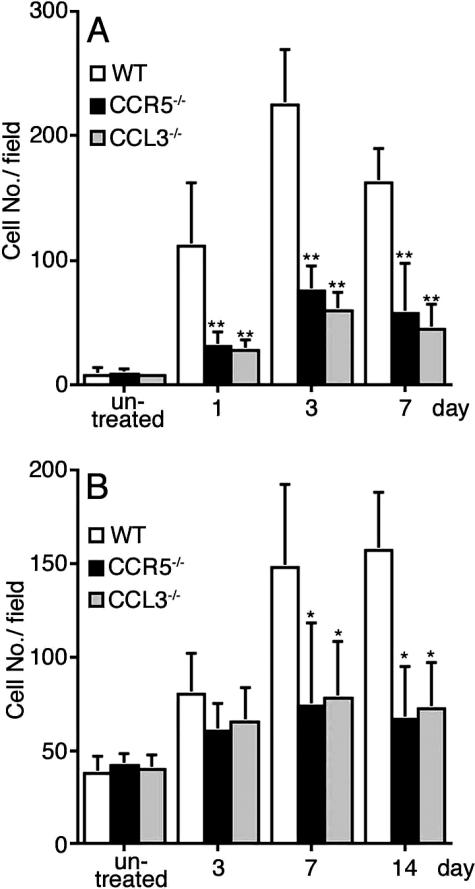
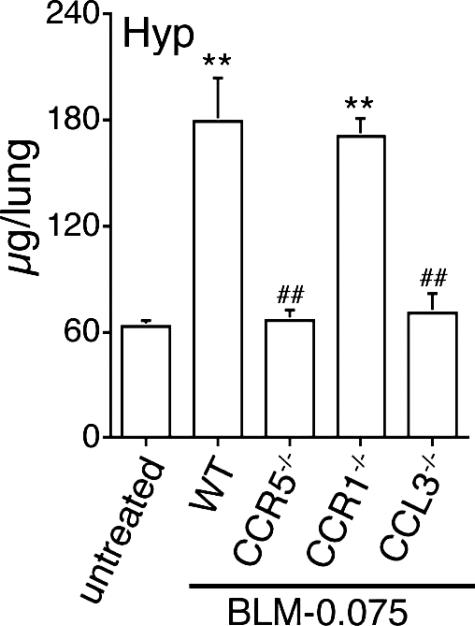
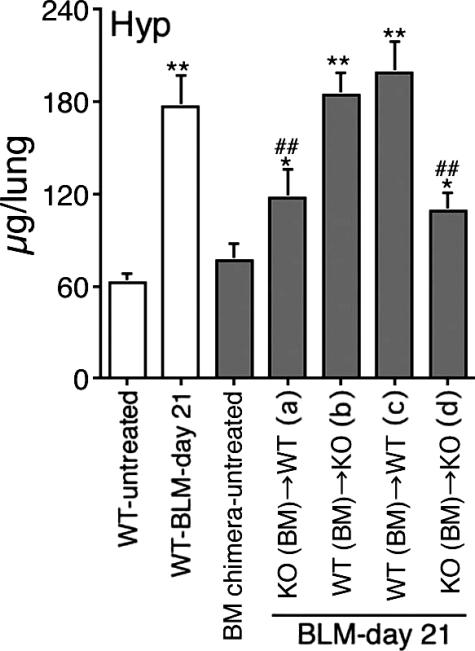
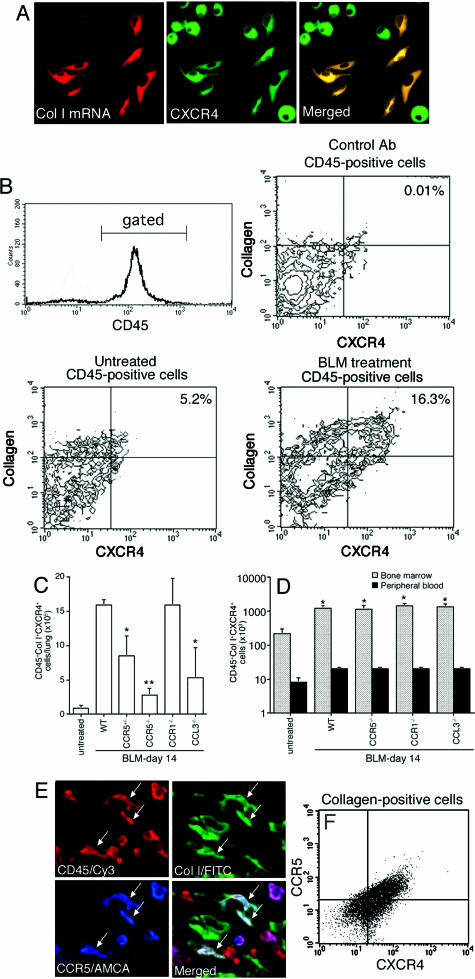
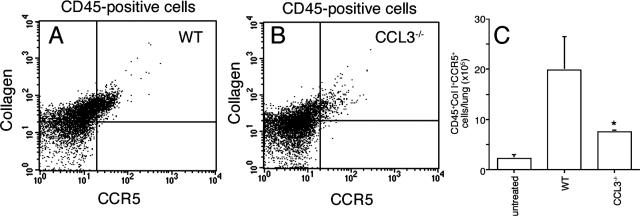
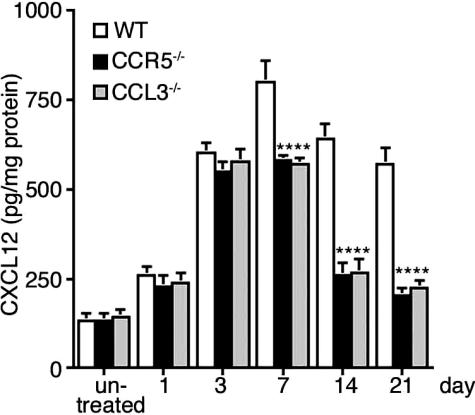
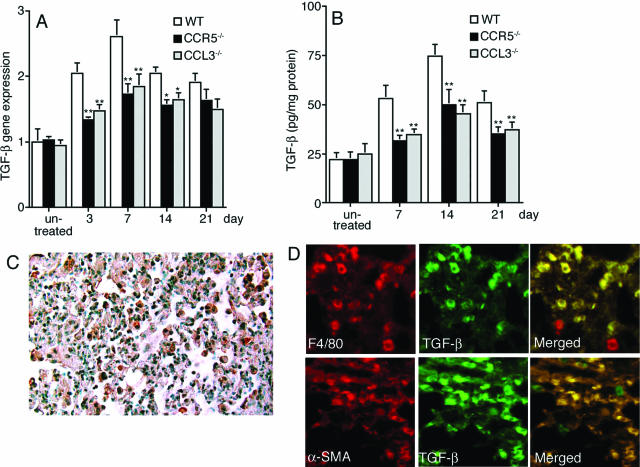
We investigated the pathogenic roles of CC chemokine ligand (CCL)3 and its receptors, CC chemokine receptor (CCR)1 and CCR5, in bleomycin (BLM)-induced pulmonary fibrosis (PF). An intratracheal injection of BLM into wild-type (WT) mice caused a massive infiltration of granulocytes and macrophages, followed by the development of diffuse PF with fibrocyte accumulation. Intrapulmonary CCL3 expression was enhanced rapidly and remained at elevated levels until PF developed. Moreover, CCL3 protein was detected mainly in infiltrating granulocytes and macrophages, whereas transforming growth factor-beta1 protein was detected in macrophages and myofibroblasts. Compared with WT mice, collagen accumulation was reduced in CCL3(-/-) and CCR5(-/-) but not CCR1(-/-) mice. Moreover, the BLM-induced increases in intrapulmonary macrophage and fibrocyte numbers were attenuated in CCL3(-/-) and CCR5(-/-) but not CCR1(-/-) mice, although BLM increased bone marrow (BM) fibrocyte number to a similar extent in these strains. BM transplantation from CCR5(-/-) to WT, but not that from WT to CCR5(-/-) mice, recapitulated the phenotypes in CCR5(-/-) mice. Furthermore, CCR5(+/-) mice exhibited a significant reduction in BLM-induced fibrotic changes. These results demonstrated that locally produced CCL3 was involved in BLM-induced recruitment of BM-derived macrophages and fibrocytes, main producers of transforming growth factor-beta1, and subsequent development of PF by interacting mainly with CCR5.


Figures

Figure 1
Figure 1
CC chemokine expression in the lungs of WT mice after BLM treatment. A–D: RT-PCR was performed on total RNAs extracted from the lungs at the indicated time intervals after BLM treatment as described in Materials and Methods. Representative results from six independent experiments are shown in A. The ratios of CCL3 (B), CCL4 (C), and CCL5 (D) to β-actin were calculated. Each value represents mean ± SEM (n = 6). *P < 0.05; **P < 0.01, versus untreated WT lungs.
Figure 2
Figure 2
Intrapulmonary CCL3 protein expression after BLM treatment. A: Intrapulmonary CCL3 contents were determined by ELISA and are shown here. Each value represents mean ± SEM (n = 6). **P < 0.01, versus untreated WT lungs. B: Immunohistochemical detection of CCL3 protein in the lungs of WT mice at 7 days after BLM treatment. A representative result from six independent experiments is shown here. C: A double-color immunofluorescence analysis of CCL3-expressing cells in the lungs of WT mice at 7 days after BLM treatment. Representative results from six independent experiments are shown here. The fluorescent images were digitally merged (right column). Original magnifications, ×200 (B).
Figure 3
Figure 3
Histopathological observations on lungs from WT, CCR5−/−, CCR1−/−, and CCL3−/− mice after BLM treatment. Representative results from six animals at each time point are shown. Original magnifications: ×100 (H&E stain); ×40 (Masson’s stain).
Figure 4
Figure 4
The numbers of granulocytes and macrophages in the lung tissue after BLM treatment. Lung tissues were obtained from WT, CCL3−/−, and CCR5−/− mice at the indicated time intervals after BLM treatment and were immunostained with anti-Ly6G and anti-F4/80 antibodies to determine the numbers of granulocytes (A) and macrophages (B), respectively. The cell numbers were counted per microscopic field at ×200 magnification. Each value represents mean ± SEM (n = 6). *P < 0.05; **P < 0.01, versus WT mice at the same time points.
Figure 5
Figure 5
Hyp contents in the lung at 21 days after BLM treatment. Hyp contents were determined as an indicator of collagen contents. Each value represents mean ± SEM (n = 6). **P < 0.01, versus untreated WT lungs. ##P < 0.01, versus BLM-treated WT lungs.
Figure 6
Figure 6
The effects of BM transplantation on BLM-induced PF. Recipient female mice were transplanted with BM cells from CCR5−/− or WT male donors as described in Materials and Methods. BM chimera mice were injected with BLM 60 days after BM transplantation. Intrapulmonary Hyp contents were determined as an indicator of collagen contents 21 days after BLM treatment as described in Materials and Methods. There was no difference in Hyp contents among all four BM chimera mice before BLM challenge. Each value represents mean ± SEM (n = 6). *P < 0.05; **P < 0.01, versus untreated WT lungs. ##P < 0.01, versus BLM-treated WT mice.
Figure 7
Figure 7
A: Detection of collagen I mRNA in CXCR4+ CD45+ cells. CD45+ cells, which were isolated from the whole lung were processed to in situ hybridization and immunofluorescence analysis, to detect collagen I mRNA and CXCR4 expression, respectively, as described in Materials and Methods. Representative results from six independent experiments are shown here. Similar results were obtained when BM-derived CD45+ cells were used. Original magnifications, ×400. B: Flow cytometric analysis on CD45+CXCR4+Col I+ fibrocytes in the lungs, BM, and peripheral blood at 14 days after BLM challenge. Single-cell suspensions were isolated from the BM, peripheral blood, and lungs, and stained with the combination of anti-CD45, anti-CXCR4, and anti-Col I Abs, followed by a flow cytometric analysis, as described in Materials and Methods. Representative results on lung single cell suspensions from six individual WT mice are shown here with a contour plotting. Normal rabbit IgG was used as a negative control to gate collagen-positive signals (B, top left). C: The numbers of fibrocytes were calculated on lungs. Each value represents mean ± SEM (n = 6). *P < 0.05; **P < 0.01, versus BLM-treated WT mice. D: The numbers of fibrocytes were calculated on BM and peripheral blood. Each value represents mean ± SEM (n = 6). *P < 0.05, versus untreated mice. E: A triple-color immunofluorescence analysis of CCR5-expressing cells in the lungs of WT mice at 14 days after BLM challenge. CD45+Col I+ fibrocytes expressed CCR5 (arrows). Representative results from six independent experiments are shown here. Original magnifications, ×400. F: Flow cytometric analysis on the portion of CCR5-positive fibrocytes co-expressing CXCR4. Representative results are shown here.
Figure 8
Figure 8
A and B: Flow cytometric analysis on CCR5+ fibrocytes in the lungs of WT and CCL3−/− mice at 14 days after BLM treatment. Single-cell suspensions were isolated from lungs and stained with the combination of anti-CD45, anti-CCR5, and anti-Col I Abs, followed by a flow cytometric analysis. Representative results from six independent experiments are shown in A (WT) and B (CCL3−/−). C: The numbers of intrapulmonary CCR5+ fibrocytes were calculated, and are shown here. Each value represents mean ± SEM (n = 6). *P < 0.05, WT versus CCL3−/− mice.
Figure 9
Figure 9
Intrapulmonary CXCL12 protein contents after BLM treatment. Intrapulmonary CXCL12 contents in WT, CCR5−/−, and CCL3−/− mice were determined by ELISA and are shown here. Each value represents mean ± SEM (n = 6). **P < 0.01 versus WT mice at the same time points.
Figure 10
Figure 10
TGF-β1 expression in lungs after BLM treatment. A: RT-PCR analysis for TGF-β1 was performed. The ratios of TGF-β1 to β-actin of WT, CCR5−/−, and CCL3−/− mice were determined and are shown here. Each value represents mean ± SEM (n = 6). *P < 0.05; **P < 0.01 versus WT mice at the same time points. B: Intrapulmonary TGF-β1 protein contents were determined by ELISA as described in Materials and Methods. Each value represents mean ± SEM (n = 6). **P < 0.01 versus WT mice at the same time points. C: Immunohistochemical analysis for TGF-β protein was performed. A representative result at 14 days after BLM treatment is shown here. D: A double-color immunofluorescence analysis of TGF-β1-expressing cells. Lungs were obtained from WT mice at 14 days after BLM treatment. The sections were stained with the combination of anti-α-SMA (Cy3) and anti-TGF-β1 (FITC) and observed under fluorescent microscopy. The fluorescent images were digitally merged (right column). Representative results from six independent experiments are shown here. Original magnifications: ×200 (C); ×400 (D).

References

    1. Gross TJ, Hunninghake GW. Idiopathic pulmonary fibrosis. N Engl J Med. 2001;345:517–525. - PubMed
    1. American Thoracic Society Idiopathic pulmonary fibrosis: diagnosis and treatment. International consensus statement. American Thoracic Society (ATS), and the European Respiratory Society (ERS). Am J Respir Crit Care Med. 2000;161:646–664. - PubMed
    1. Chabner BA, Ryan DP, Paz-Ares L, Garcia-Carbonero R, Calabresi P. Antineoplastic agents. Hardman JG, Limbird LE, editors. New York: McGraw-Hill,; The Pharmacological Basis of Therapeutics, (ed 10) 2003:pp 1429–1430.
    1. Bowden DH. Unraveling pulmonary fibrosis: the bleomycin model. Lab Invest. 1984;50:487–488. - PubMed
    1. Chesney J, Metz C, Stavitsky AB, Bacher M, Bucala R. Regulated production of type I collagen and inflammatory cytokines by peripheral blood fibrocytes. J Immunol. 1998;160:419–425. - PubMed

Publication types

MeSH terms