Calcitonin and prednisolone display antagonistic actions on bone and have synergistic effects in experimental arthritis
- PMID: 17322385
- PMCID: PMC1864877
- DOI: 10.2353/ajpath.2007.060830
Calcitonin and prednisolone display antagonistic actions on bone and have synergistic effects in experimental arthritis
Abstract
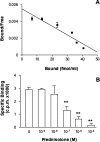
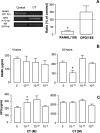
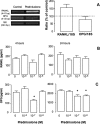
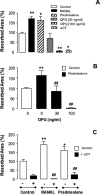
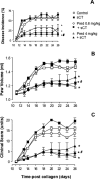
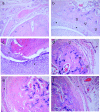
We tested here the hypothesis that calcitonin and glucocorticoids, known to modulate bone metabolism, could have opposite actions on bone cells regulating expression of cytokine receptor activator of nuclear factor-kappaBeta ligand (RANKL) and osteoprotegerin (OPG). In the U2OS osteosarcoma cell line, calcitonin (10(-11) to 10(-9) mol/L) reduced RANKL and augmented OPG both at the mRNA and protein levels. Cell incubation with prednisolone (10(-8) to 10(-6) mol/L), the glucocorticoid chosen for this study, produced opposite results. These molecular studies prompted more functional analyses whereby osteoclast bone resorptive activity was determined. Calcitonin (10(-10) mol/L) abrogated the stimulating effect of 10 ng/ml RANKL or 10(-9) mol/L prednisolone; similar results were obtained with OPG. Assessment of calcitonin and prednisolone effects in an in vivo model of rheumatoid arthritis revealed partially surprising results. In fact, calcitonin not only preserved bone morphology (as assessed on day 18) in rats subjected to arthritis and treated with prednisolone (0.8 to 4 mg/kg daily from day 13) but also synergized with the steroid to elicit its antiarthritic effects. These results suggest that calcitonin could be used as a novel cotreatment to augment efficacy and reduce side effects associated with the prolonged use of steroids.
Figures

Similar articles
-
Effects of dissociated glucocorticoids on OPG and RANKL in osteoblastic cells.Bone. 2006 May;38(5):652-61. doi: 10.1016/j.bone.2005.10.004. Epub 2005 Nov 17. Bone. 2006. PMID: 16298558
-
Increase in expression of receptor activator of nuclear factor kappaB at sites of bone erosion correlates with progression of inflammation in evolving collagen-induced arthritis.Arthritis Rheum. 2002 Nov;46(11):3055-64. doi: 10.1002/art.10607. Arthritis Rheum. 2002. PMID: 12428250
-
Osteoclast inhibitory effects of vitamin K2 alone or in combination with etidronate or risedronate in patients with rheumatoid arthritis: 2-year results.J Rheumatol. 2008 Mar;35(3):407-13. Epub 2008 Feb 1. J Rheumatol. 2008. PMID: 18260178 Clinical Trial.
-
[The OPG/RANKL/RANK system and bone resorptive disease].Sheng Wu Gong Cheng Xue Bao. 2003 Nov;19(6):655-60. Sheng Wu Gong Cheng Xue Bao. 2003. PMID: 15971575 Review. Chinese.
-
Signaling axis in osteoclast biology and therapeutic targeting in the RANKL/RANK/OPG system.Am J Nephrol. 2007;27(5):466-78. doi: 10.1159/000106484. Epub 2007 Jul 25. Am J Nephrol. 2007. PMID: 17652963 Review.
Cited by
-
Alpha-methylprednisolone conjugated cyclodextrin polymer-based nanoparticles for rheumatoid arthritis therapy.Int J Nanomedicine. 2008;3(3):359-71. doi: 10.2147/ijn.s3217. Int J Nanomedicine. 2008. PMID: 18990945 Free PMC article.
-
Oral calcitonin.Int J Womens Health. 2012;4:471-9. doi: 10.2147/IJWH.S24776. Epub 2012 Sep 6. Int J Womens Health. 2012. PMID: 23071417 Free PMC article.
-
Combination therapy with dexamethasone and osteoprotegerin protects against arthritis-induced bone alterations in antigen-induced arthritis of the rat.Inflamm Res. 2010 Sep;59(9):731-41. doi: 10.1007/s00011-010-0184-6. Epub 2010 Mar 20. Inflamm Res. 2010. PMID: 20306217
-
Calcitonin and Bone Physiology: In Vitro, In Vivo, and Clinical Investigations.Int J Endocrinol. 2020 Sep 10;2020:3236828. doi: 10.1155/2020/3236828. eCollection 2020. Int J Endocrinol. 2020. PMID: 32963524 Free PMC article. Review.
-
[Effect of collagen peptides from walleye pollock skin on bone microstructure of ovariectomized rats].Zhongguo Xiu Fu Chong Jian Wai Ke Za Zhi. 2017 Oct 15;31(10):1214-1219. doi: 10.7507/1002-1892.201704130. Zhongguo Xiu Fu Chong Jian Wai Ke Za Zhi. 2017. PMID: 29806323 Free PMC article. Chinese.
References
-
- Lacey DL, Timms E, Tan HL, Kelley MJ, Dunstan CR, Burgess T, Elliott R, Colombero A, Elliott G, Scully S, Hsu H, Sullivan J, Hawkins N, Davy E, Capparelli C, Eli A, Qian YX, Kaufman S, Sarosi I, Shalhoub V, Senaldi G, Guo J, Delaney J, Boyle WJ. Osteoprotegerin ligand is a cytokine that regulates osteoclast differentiation and activation. Cell. 1998;93:165–176. - PubMed
-
- Yasuda H, Shima N, Nakagawa N, Yamaguchi K, Kinosaki M, Mochizuki S, Tomoyasu A, Yano K, Goto M, Murakami A, Tsuda E, Morinaga T, Higashio K, Udagawa N, Takahashi N, Suda T. Osteoclast differentiation factor is a ligand for osteoprotegerin/osteoclastogenesis-inhibitory factor and is identical to TRANCE/RANKL. Proc Natl Acad Sci USA. 1998;95:3597–3602. - PMC - PubMed
-
- Kong YY, Feige U, Sarosi I, Bolon B, Tafuri A, Morony S, Capparelli C, Li J, Elliott R, McCabe S, Wong T, Campagnuolo G, Moran E, Bogoch ER, Van G, Nguyen LT, Ohashi PS, Lacey DL, Fish E, Boyle WJ, Penninger JM. Activated T cells regulate bone loss and joint destruction in adjuvant arthritis through osteoprotegerin ligand. Nature. 1999;402:304–309. - PubMed
-
- Wada T, Nakashima T, Hiroshi N, Penninger JM. RANKL-RANK signaling in osteoclastogenesis and bone disease. Trends Mol Med. 2006;12:17–25. - PubMed
-
- Simonet WS, Lacey DL, Dunstan CR, Kelley M, Chang MS, Luthy R, Nguyen HQ, Wooden S, Bennett L, Boone T, Shimamoto G, DeRose M, Elliott R, Colombero A, Tan HL, Trail G, Sullivan J, Davy E, Bucay N, Renshaw-Gegg L, Hughes TM, Hill D, Pattison W, Campbell P, Sander S, Van G, Tarpley J, Derby P, Lee R, Boyle WJ. Osteoprotegerin: a novel secreted protein involved in the regulation of bone density. Cell. 1997;89:309–319. - PubMed
MeSH terms
Substances
LinkOut - more resources
Full Text Sources
Medical

