

Detection of urinary drug metabolite (xenometabolome) signatures in molecular epidemiology studies via statistical total correlation (NMR) spectroscopy
- PMID: 17323917
- PMCID: PMC6688492
- DOI: 10.1021/ac062305n
Detection of urinary drug metabolite (xenometabolome) signatures in molecular epidemiology studies via statistical total correlation (NMR) spectroscopy
Erratum in
- Anal Chem. 2008 Aug 1;80(15):6142-3
Abstract
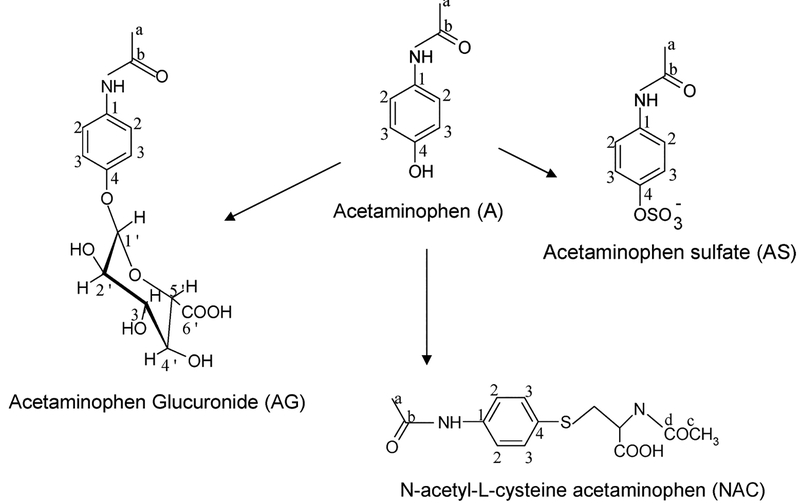
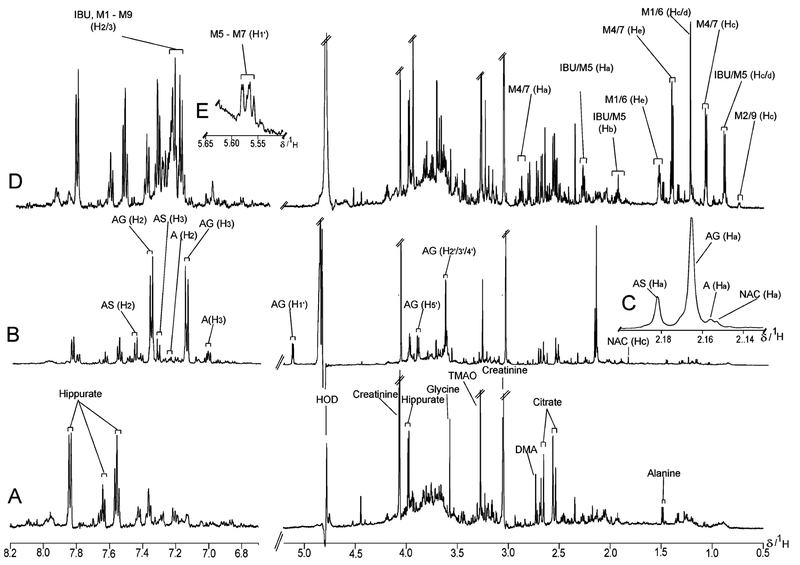
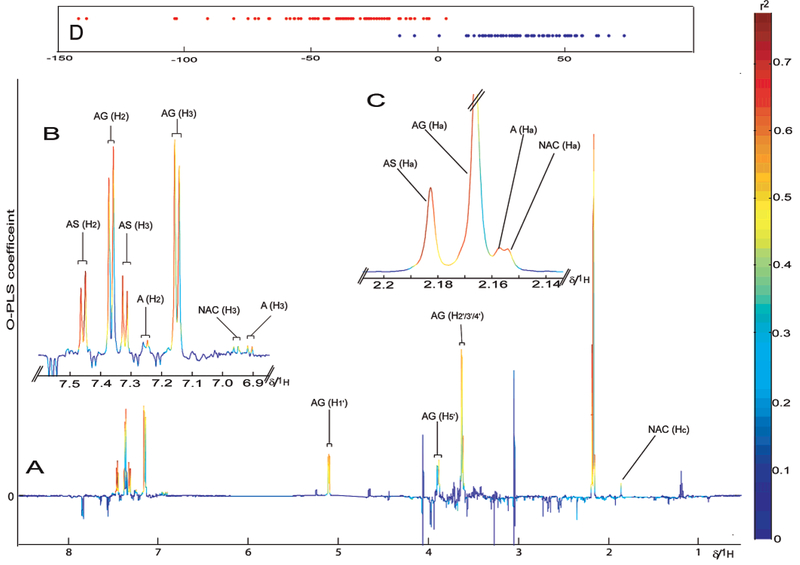
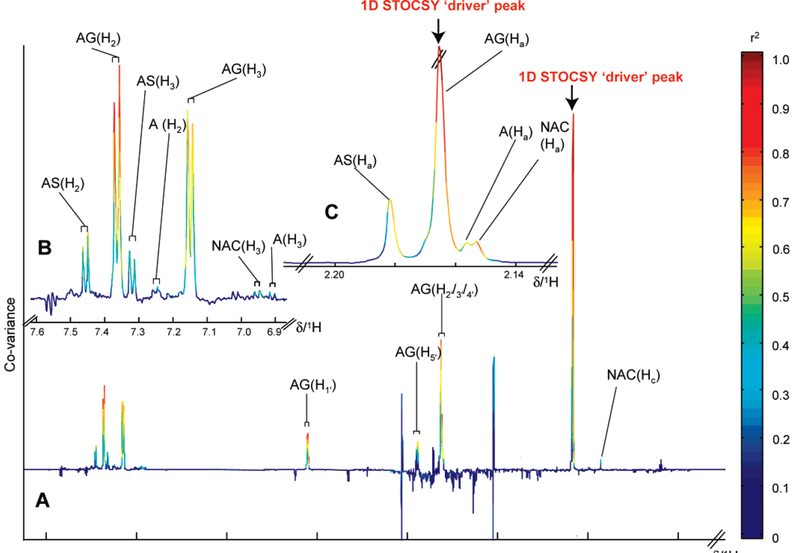
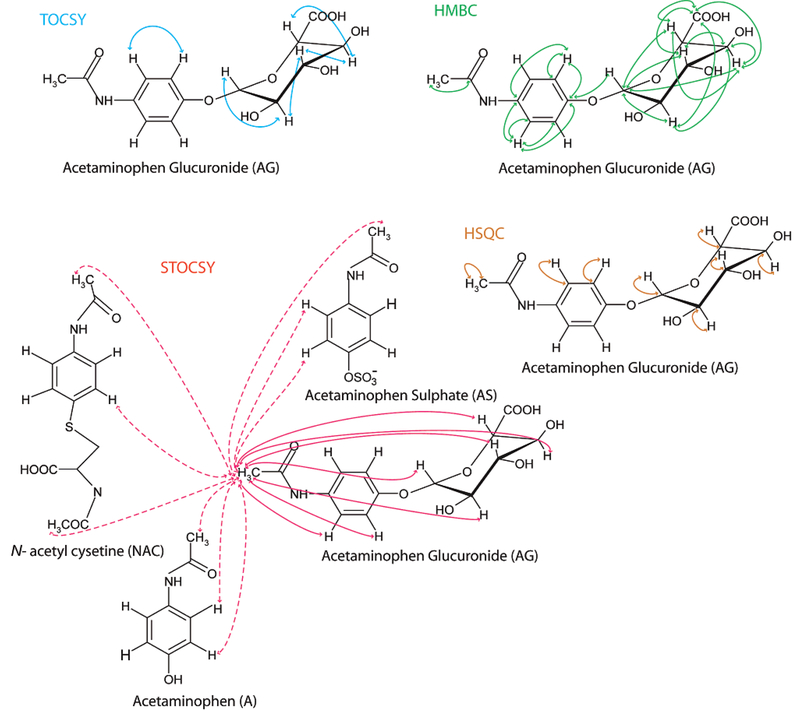
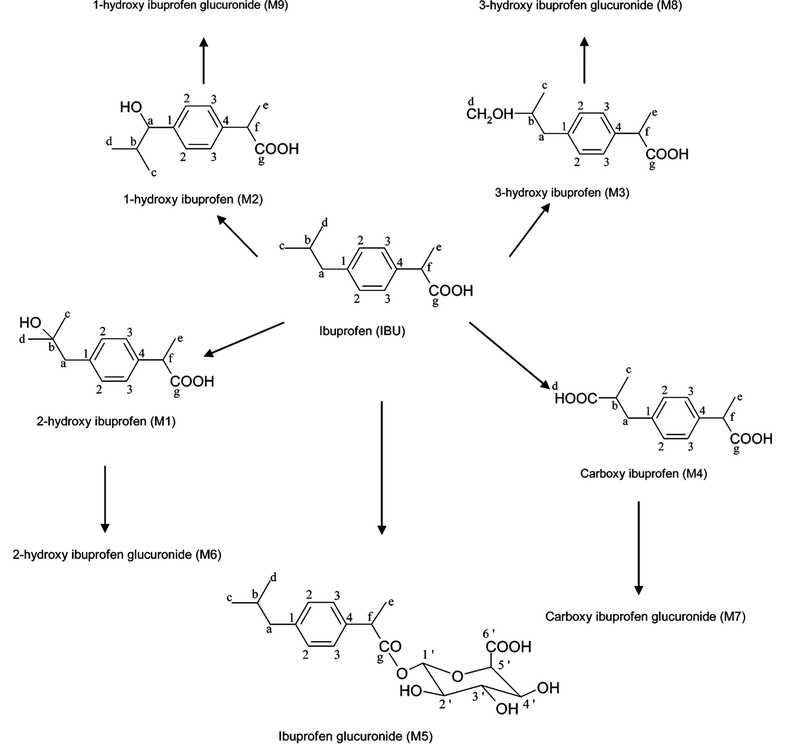
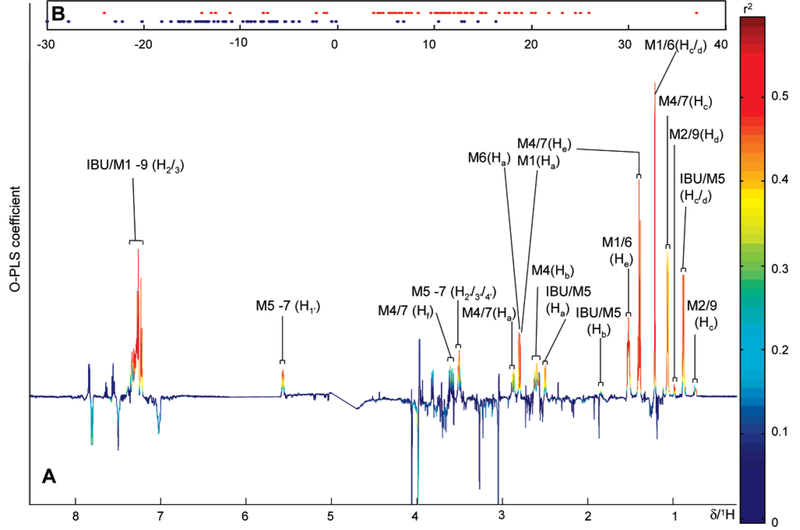
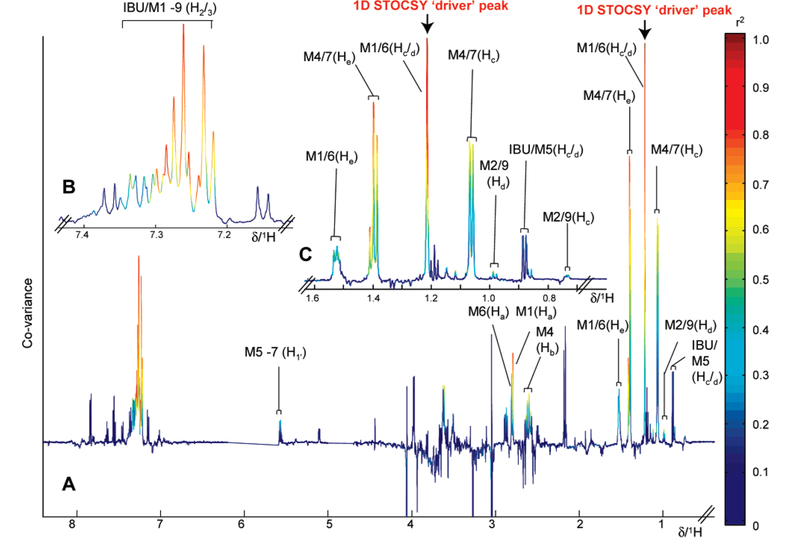
Western populations use prescription and nonprescription drugs extensively, but large-scale population usage is rarely assessed objectively in epidemiological studies. Here we apply statistical methods to characterize structural pathway connectivities of metabolites of commonly used drugs detected routinely in 1H NMR spectra of urine in a human population study. 1H NMR spectra were measured for two groups of urine samples obtained from U.S. participants in a known population study. The novel application of a statistical total correlation spectroscopy (STOCSY) approach enabled rapid identification of the major and certain minor drug metabolites in common use in the population, in particular, from acetaminophen and ibuprofen metabolites. This work shows that statistical connectivities between drug metabolites can be established in routine "high-throughput" NMR screening of human samples from participants who have randomly self-administered drugs. This approach should be of value in considering interpopulation patterns of drug metabolism in epidemiological and pharmacogenetic studies.
Figures
Similar articles
-
Metabolic profiling and population screening of analgesic usage in nuclear magnetic resonance spectroscopy-based large-scale epidemiologic studies.Anal Chem. 2009 Jul 1;81(13):5119-29. doi: 10.1021/ac900567e. Anal Chem. 2009. PMID: 19489597 Free PMC article.
-
A comparison of self-reported analgesic use and detection of urinary ibuprofen and acetaminophen metabolites by means of metabonomics: the INTERMAP Study.Am J Epidemiol. 2012 Feb 15;175(4):348-58. doi: 10.1093/aje/kwr292. Epub 2012 Jan 5. Am J Epidemiol. 2012. PMID: 22223708 Free PMC article.
-
1H NMR and UPLC-MS(E) statistical heterospectroscopy: characterization of drug metabolites (xenometabolome) in epidemiological studies.Anal Chem. 2008 Sep 15;80(18):6835-44. doi: 10.1021/ac801075m. Epub 2008 Aug 14. Anal Chem. 2008. PMID: 18700783
-
Population studies of drug metabolites in urine.Anal Chem. 2007 Apr 1;79(7):2607. doi: 10.1021/ac062219n. Epub 2007 Feb 28. Anal Chem. 2007. PMID: 17326612 No abstract available.
-
Metabolic phenotyping applied to pre-clinical and clinical studies of acetaminophen metabolism and hepatotoxicity.Drug Metab Rev. 2015 Feb;47(1):29-44. doi: 10.3109/03602532.2014.982865. Epub 2014 Dec 23. Drug Metab Rev. 2015. PMID: 25533740 Review.
Cited by
-
Omics era in forensic medicine: towards a new age.Turk J Med Sci. 2020 Aug 26;50(5):1480-1490. doi: 10.3906/sag-1912-197. Turk J Med Sci. 2020. PMID: 32283897 Free PMC article. Review.
-
Simultaneous Quantification of Amino Metabolites in Multiple Metabolic Pathways Using Ultra-High Performance Liquid Chromatography with Tandem-mass Spectrometry.Sci Rep. 2017 May 3;7(1):1423. doi: 10.1038/s41598-017-01435-7. Sci Rep. 2017. PMID: 28469184 Free PMC article.
-
Application of (1)h NMR spectroscopy-based metabolomics to sera of tuberculosis patients.J Proteome Res. 2013 Oct 4;12(10):4642-9. doi: 10.1021/pr4007359. Epub 2013 Sep 10. J Proteome Res. 2013. PMID: 23980697 Free PMC article.
-
Metabolic phenotyping for discovery of urinary biomarkers of diet, xenobiotics and blood pressure in the INTERMAP Study: an overview.Hypertens Res. 2017 Apr;40(4):336-345. doi: 10.1038/hr.2016.164. Epub 2016 Dec 22. Hypertens Res. 2017. PMID: 28003647 Free PMC article. Review.
-
Use of optimized 1D TOCSY NMR for improved quantitation and metabolomic analysis of biofluids.J Biomol NMR. 2011 Apr;49(3-4):281-90. doi: 10.1007/s10858-011-9483-7. Epub 2011 Mar 10. J Biomol NMR. 2011. PMID: 21516384 Free PMC article.
References
-
- Stamler J Am. J. Clin. Nutr 1997, 65 (2 Suppl), 626S–42S. - PubMed
Publication types
MeSH terms
Substances
Grants and funding
LinkOut - more resources
Full Text Sources
Other Literature Sources
