Comparative Study
. 2007;8(2):R25.
doi: 10.1186/gb-2007-8-2-r25.

DNA variation and brain region-specific expression profiles exhibit different relationships between inbred mouse strains: implications for eQTL mapping studies

Affiliations
Comparative Study

DNA variation and brain region-specific expression profiles exhibit different relationships between inbred mouse strains: implications for eQTL mapping studies

Iiris Hovatta et al. Genome Biol. 2007.

Abstract

Background: Expression quantitative trait locus (eQTL) mapping is used to find loci that are responsible for the transcriptional activity of a particular gene. In recent eQTL studies, expression profiles were derived from either homogenized whole brain or collections of large brain regions. However, the brain is a very heterogeneous organ, and expression profiles of different brain regions vary significantly. Because of the importance and potential power of eQTL studies in identifying regulatory networks, we analyzed gene expression patterns in different brain regions from multiple inbred mouse strains and investigated the implications for the design and analysis of eQTL studies.

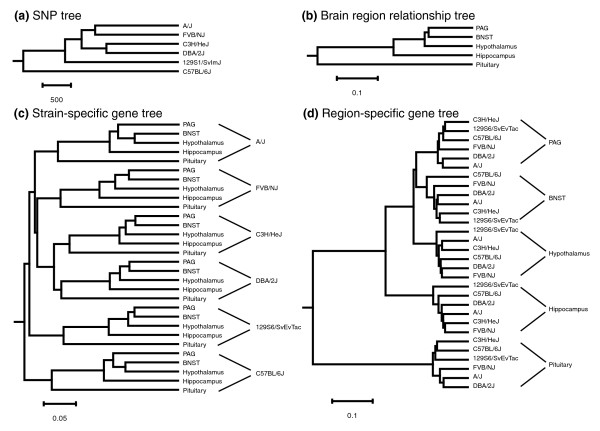
Results: Gene expression profiles of five brain regions in six inbred mouse strains were studied. Few genes exhibited a significant strain-specific expression pattern, whereas a large number of genes exhibited brain region-specific patterns. We constructed phylogenetic trees based on the expression relationships between the strains and compared them with a DNA-level relationship tree. The trees based on the expression of strain-specific genes were constant across brain regions and mirrored DNA-level variation. However, the trees based on region-specific genes exhibited a different set of strain relationships, depending on the brain region. An eQTL analysis showed enrichment of cis-acting regulators among strain-specific genes, whereas brain region-specific genes appear to be mainly regulated by trans-acting elements.

Conclusion: Our results suggest that many regulatory networks are highly brain region specific and indicate the importance of conducting eQTL mapping studies using data from brain regions or tissues that are physiologically and phenotypically relevant to the trait of interest.


Figures

Figure 1
Figure 1
Relationships of inbred mouse strains. (a) A phylogenetic tree based on the fraction of allelic differences across 12,473 loci between inbred mouse strains. (b) A phylogenetic tree based on the gene expression differences between brain regions averaged over six inbred mouse strains used in this study. (c) A phylogenetic tree based on the gene expression relationship of 2,235 strain-specific genes. (d) A phylogenetic tree based on the gene expression relationship of 19,813 brain region-specific genes. Scale bars show the number of allelic differences (panel a) or the distance based on gene expression (panels b, c, and d). BNST, bed nucleus of the stria terminalis; PAG, periaqueductal gray; SNP, single nucleotide polymorphism.
Figure 2
Figure 2
Brain gene expression levels of Penk (encoding preproenkephalin) and Foxp1 (encoding forkhead box P1). The signal intensities of two genes, Penk and Foxp1, were imported into the NeuroZoom software tool to visualize the three-dimensional gene expression patterns of these genes in the context of brain anatomy. A ratio of the signal intensities of (a) Penk and (b) Foxp1 between 129S6/SvEvTac (129) and A/J (A) strains is shown in hippocampus (Hi), hypothalamus (Hyp), periaqueductal gray (PAG), and bed nucleus of the stria terminalis (BNST). The expression fold change values are shown in the upper right corner of each panel for each brain region separately, together with color coding that matches the color of each brain region in the three-dimensional mouse brain atlas, shown from four different angles. Note that the gene expression level of Penk in Hi and Hyp is higher in the 129 strain than in the A strain, but in Pag and Bnst it is higher in the A strain than in the 129 strain. Similarly, the expression level of Foxp1 in Hi is higher in the 129 strain than in the A strain, whereas in Hyp, Bnst, and Pag the expression level is higher in the A strain than in the 129 strain.

References

    1. Morley M, Molony CM, Weber TM, Devlin JL, Ewens KG, Spielman RS, Cheung VG. Genetic analysis of genome-wide variation in human gene expression. Nature. 2004;430:743–747. doi: 10.1038/nature02797. - DOI - PMC - PubMed
    1. Schadt EE, Monks SA, Drake TA, Lusis AJ, Che N, Colinayo V, Ruff TG, Milligan SB, Lamb JR, Cavet G, et al. Genetics of gene expression surveyed in maize, mouse and man. Nature. 2003;422:297–302. doi: 10.1038/nature01434. - DOI - PubMed
    1. Monks SA, Leonardson A, Zhu H, Cundiff P, Pietrusiak P, Edwards S, Phillips JW, Sachs A, Schadt EE. Genetic Inheritance of Gene Expression in Human Cell Lines. Am J Hum Genet. 2004;75:1094–1105. doi: 10.1086/426461. - DOI - PMC - PubMed
    1. Chesler EJ, Lu L, Shou S, Qu Y, Gu J, Wang J, Hsu HC, Mountz JD, Baldwin NE, Langston MA, et al. Complex trait analysis of gene expression uncovers polygenic and pleiotropic networks that modulate nervous system function. Nat Genet. 2005;37:233–242. doi: 10.1038/ng1518. - DOI - PubMed
    1. Hubner N, Wallace CA, Zimdahl H, Petretto E, Schulz H, Maciver F, Mueller M, Hummel O, Monti J, Zidek V, et al. Integrated transcriptional profiling and linkage analysis for identification of genes underlying disease. Nat Genet. 2005;37:243–253. doi: 10.1038/ng1522. - DOI - PubMed

Publication types