. 2007 Apr;44(11):2884-92.
doi: 10.1016/j.molimm.2007.01.014. Epub 2007 Feb 26.

A novel multimeric form of FasL modulates the ability of diabetogenic T cells to mediate type 1 diabetes in an adoptive transfer model

Affiliations

A novel multimeric form of FasL modulates the ability of diabetogenic T cells to mediate type 1 diabetes in an adoptive transfer model

Deanna D H Franke et al. Mol Immunol. 2007 Apr.

Abstract

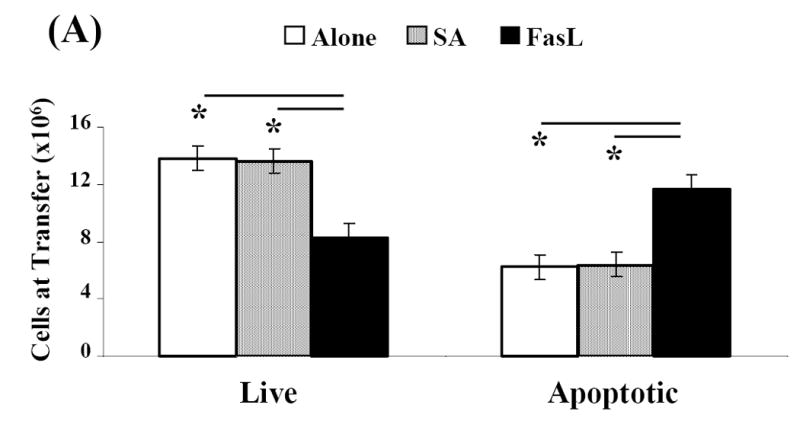
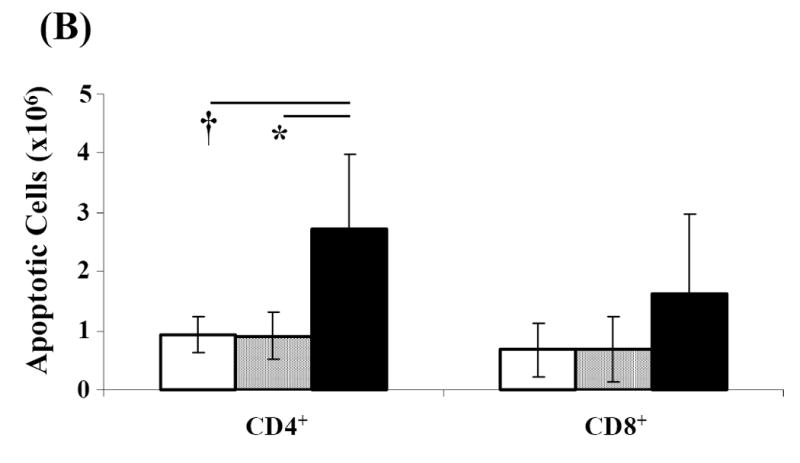
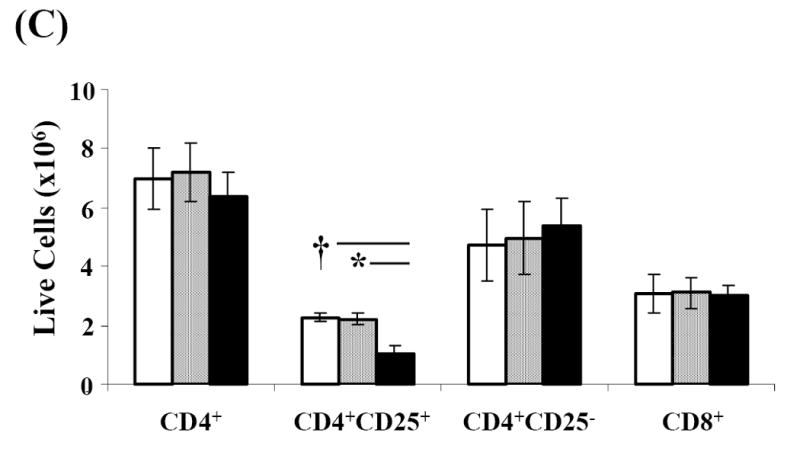
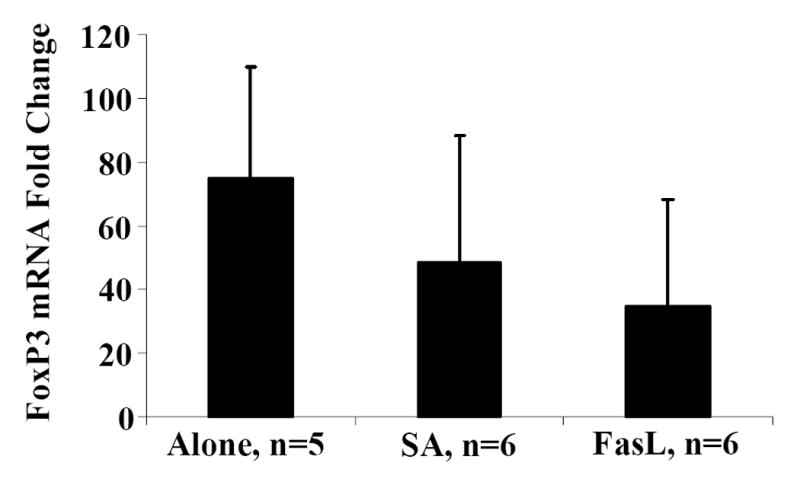
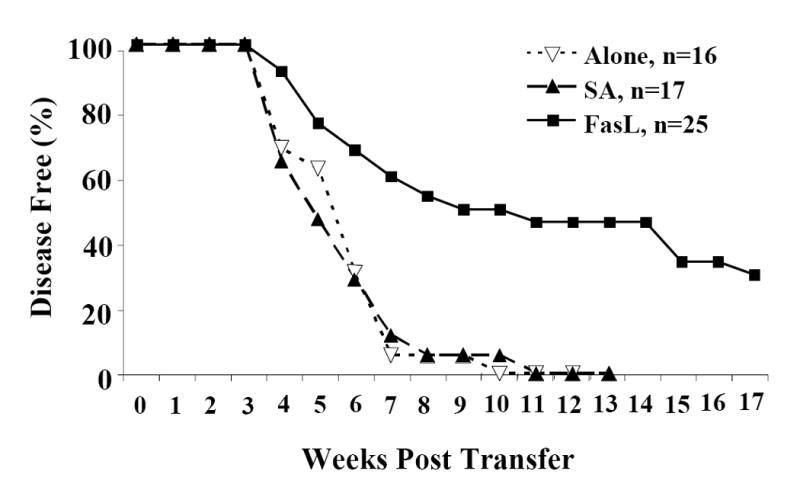
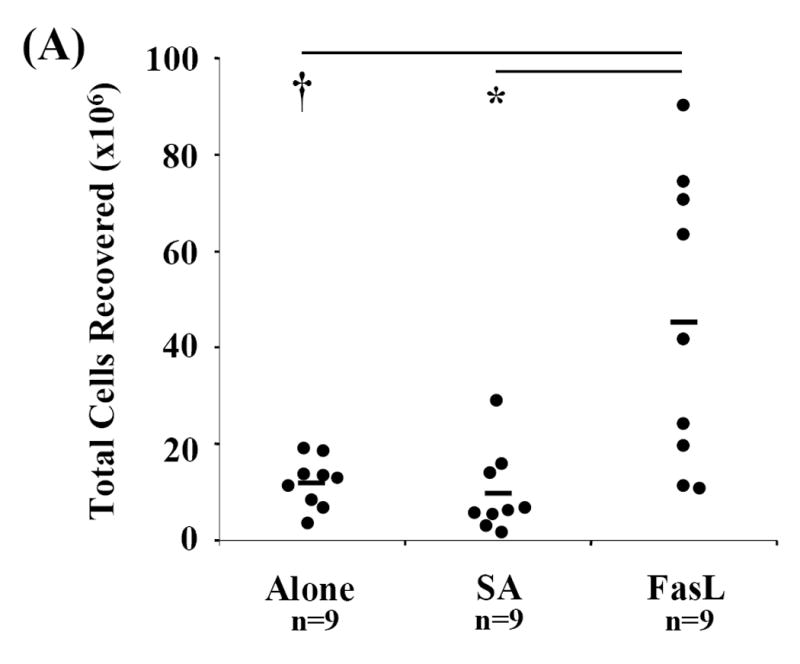
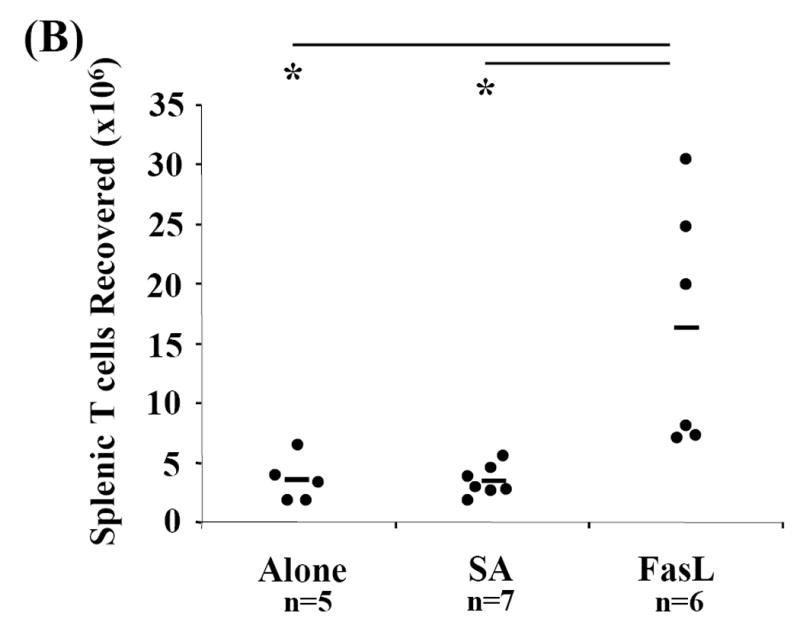
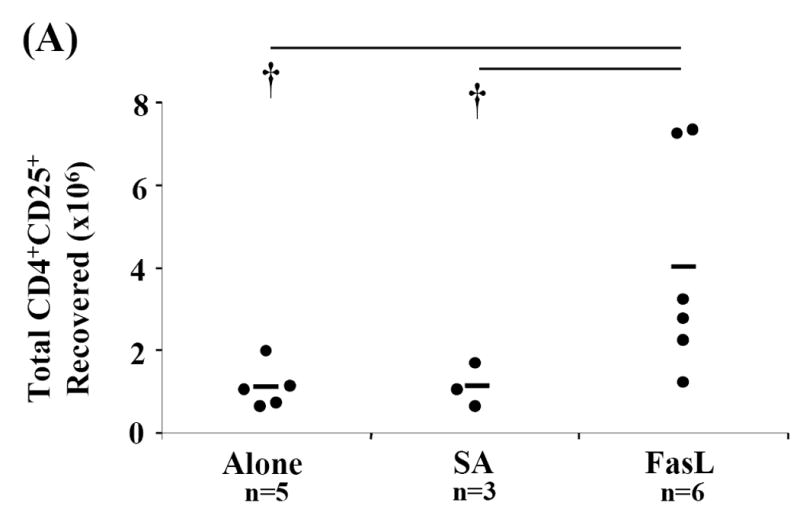
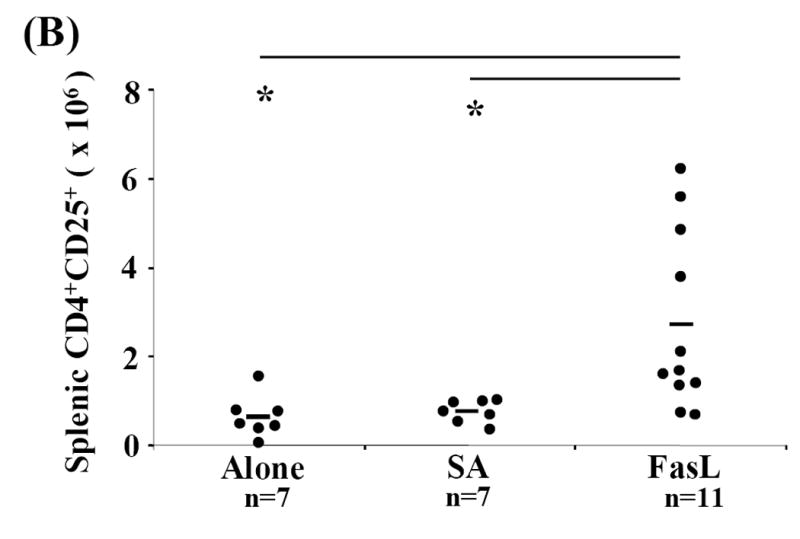
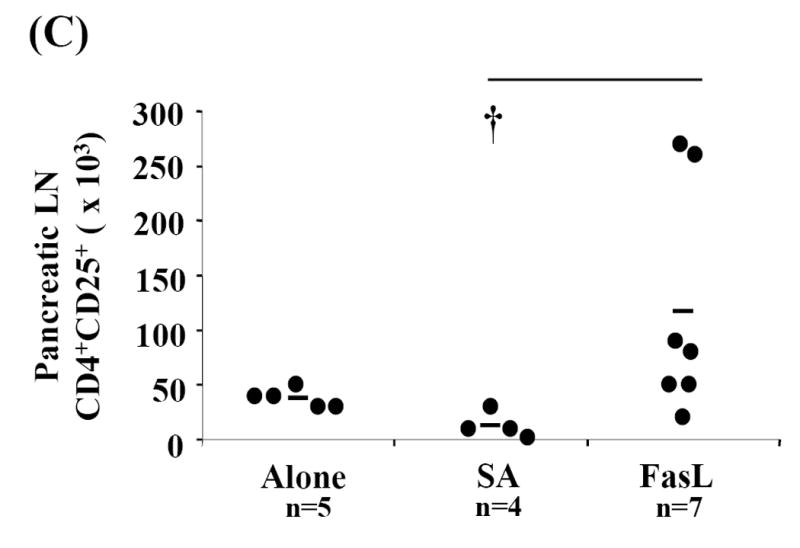
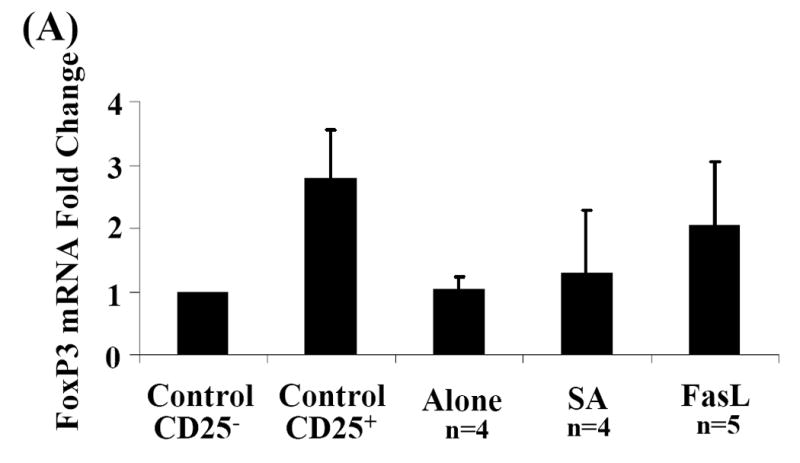
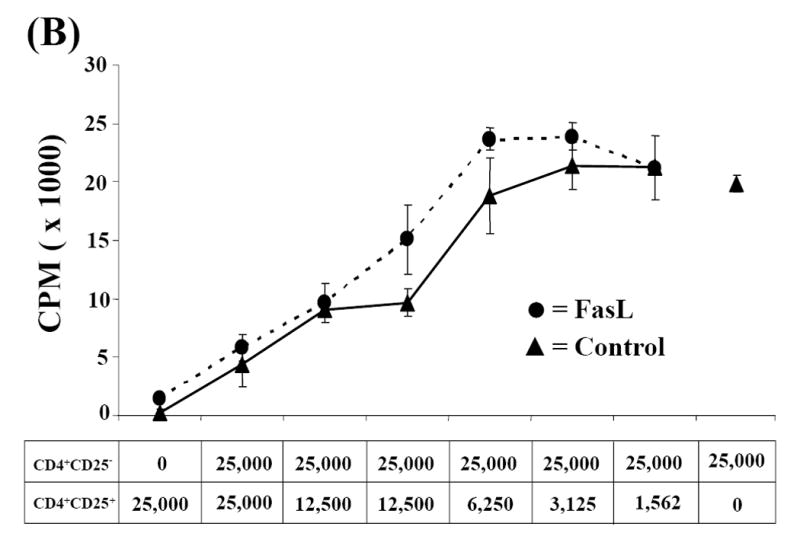
Activation induced cell death (AICD) via Fas/FasL is the primary homeostatic molecular mechanism employed by the immune system to control activated T-cell responses and promote tolerance to self-antigens. We herein investigated the ability of a novel multimeric form of FasL chimeric with streptavidin (SA-FasL) having potent apoptotic activity to induce apoptosis in diabetogenic T cells and modulate insulin-dependent type 1 diabetes (IDDM) in an adoptive transfer model. Diabetogenic splenocytes from NOD/Lt females were co-cultured in vitro with SA-FasL, SA control protein, or alone without protein, and adoptively transferred into NOD/Lt-Rag1(null) recipients for diabetes development. All animals receiving control (Alone: n=16 or SA: n=17) cells developed diabetes on average by 6 weeks, whereas animals receiving SA-FasL-treated (n=25) cells exhibited significantly delayed progression (p<.001) and decreased incidence (70%). This effect was associated with an increase in CD4(+)CD25(+) T cells and correlated with FoxP3 expression in pancreatic lymph nodes. Extracorporeal treatment of peripheral blood lymphocytes using SA-FasL during disease onset represents a novel approach that may alter the ability of pathogenic T cells to mediate diabetes and have therapeutic utility in clinical management of IDDM.


Figures

Fig. 1
Fig. 1. Effect of SA-FasL on ex vivo treated cells at transfer
Spleens from NOD mice positive for diabetes were harvested, processed, and resuspended at 4×10⁶/mL in complete MLR medium. Splenocytes were bulk cultured and treated with PBS, SA, or SA-FasL for 7.5 hours. Ex vivo treated cultures were analyzed for apoptosis (AnnexinV-FITC positive and 7-AAD negative) by flow cytometry. CD4+, CD4+CD25+, and CD8+ T-cell populations were analyzed for apoptosis using AnnexinV-FITC and T-cell antibodies: CD25-PE, CD8-PerCp, and CD4-APC. Effect of SA-FasL on ex vivo treated cells was statistically analyzed by Mann-Whitney U test. (A) Absolute number of live and apoptotic cells transferred. (B) Absolute number of CD4+ and CD8+ apoptotic cells transferred. (C) Absolute number of CD4+, CD4+CD25+, CD4+CD25-, and CD8+ live cells transferred. * P<0.01. †P<0.05.
Fig. 2
Fig. 2. FoxP3 expression in live CD4+CD25+ T-cells
Spleens from NOD mice positive for diabetes were harvested, processed, and resuspended at 4×10⁶/mL in complete MLR medium. Splenocytes were bulk cultured and treated with PBS, SA, or SA-FasL for 7.5 hours. Ex vivo treated cultures were washed and stained with a saturating amount of AnnexinV-FITC and T-cell antibodies: CD25-PE and CD4-APC. Using a high speed cell sorter, live (AnnexinV negative) CD4+CD25+ from SA-FasL and control ex vivo treated cultures were sorted and total RNA prepared. CD4+CD25+ and CD4+CD25- T cells from healthy NOD peripheral lymph node were sorted for FoxP3 mRNA controls. cDNA from sorted cells was prepared and then amplified in duplicate by real-time PCR for GAPDH and FoxP3. FoxP3 mRNA levels were normalized relative to GAPDH mRNA expression and statistically analyzed by Kruskal-Wallace test. Data are presented as the fold-change relative to CD4+CD25- T cells. P>0.05.
Fig. 3
Fig. 3. Incidence of diabetes after adoptive transfer of ex vivo treated NOD splenocytes
Diabetogenic splenocytes from NOD/Lt females were bulk cultured in vitro with PBS (Alone), control (SA), and test protein (SA-FasL) for 7.5 hours. After culture, cells were washed and 20×106ex vivo treated cells were adoptively transferred by intravenous tail vein infusion into 4-6 week old male and female NOD/Lt-Rag1null mice. For 17 weeks all recipients were monitored for diabetes development twice weekly. Diabetes incidence was assessed by Kaplan-Meier life table analysis using the Log-Rank test. All animals receiving untreated (Alone: ∇ white triangle, n=16) or control treated (SA: ▲ black triangle, n=17) cells developed overt diabetes by 73 days (11 weeks). Animals receiving FasL treated (SA-FasL: ■ black square, n=25) cells exhibited significantly delayed onset and decreased incidence. P<0.001.
Fig. 4
Fig. 4. Repopulation analyses
Spleen, mesenteric, pancreatic, and peripheral lymph nodes from recipients were harvested, processed, counted, and phenotyped by flow cytometric analysis to determine effective T cell expansion and repopulation. Each cellular compartment was phenotyped using the T cell specific surface marker CD3-FITC and statistically analyzed by Mann-Whitney U test. (A) Cell counts for each compartment and individual animals were obtained and totaled for determination of total cells recovered. (B) Absolute numbers of splenic T cells in individual recipients were calculated based on percent of CD3+ cells recovered in spleen. *P<0.01. †P<0.05.
Fig. 5
Fig. 5. CD4+CD25+ T cells are increased in SA-FasL treated long-term survivors
Spleens, mesenteric, pancreatic, and peripheral lymph nodes from individual recipients were harvested, processed, counted, and phenotyped by flow cytometric analysis to determine effective CD4+CD25+ T cell expansion and repopulation. Each cellular compartment was phenotyped using the surface markers specific for CD4+CD25+ T cells, CD3-FITC, CD25-PE, and CD4-APC and statistically analyzed by Mann-Whitney U test. (A) Absolute numbers of CD4+CD25+ T cells in individual recipients were calculated for each cellular compartment based on percent of CD3+CD4+CD25+ cells recovered. Absolute numbers of CD4+CD25+ cells calculated for each compartment were added to determine total cell recovery. Absolute numbers of (B) splenic and (C) pancreatic lymph node CD4+CD25+ T cells in individual recipients were calculated based on percent of CD3+ CD4+CD25+ cells recovered in spleen and pancreatic lymph nodes, respectively. * P<0.01. †P<0.05.
Fig. 6
Fig. 6. Analysis of FoxP3 mRNA expression and suppressive activity of CD4+CD25+ T cells in lymph node of long-term SA-FasL survivors
(A) Total RNA was extracted from whole pancreatic lymph node. cDNA was amplified in duplicate by real-time PCR for GAPDH and FoxP3. FoxP3 mRNA levels were normalized relative to GAPDH mRNA expression and statistically analyzed by Kruskal-Wallace test. Data are presented as the fold-change relative to control, sorted CD4+CD25- T cells. P>0.05. (B) CD4+CD25+ cells sorted from healthy naïve NOD peripheral lymph node (control) and long-term SA-FasL survivor pooled peripheral and pancreatic lymph nodes were cultured with control CD4+CD25- T cells at different ratios and evaluated for suppressive function. Data presented is representative of three suppression assays performed evaluating suppressive activity of CD4+CD25+ from long-term SA-FasL survivors.

Similar articles

Cited by

References

    1. Aoki CA, Borchers AT, Ridgway WM, et al. NOD mice and autoimmunity. Autoimmun Rev. 2005;4:373–379. - PubMed
    1. Arreaza G, Salojin K, Yang W, et al. Deficient activation and resistance to activationinduced apoptosis of CD8+ T cells is associated with defective peripheral tolerance in nonobese diabetic mice. Clin Immunol. 2003;107:103–115. - PubMed
    1. Askenasy N, Yolcu ES, Wang Z, et al. Display of Fas ligand protein on cardiac vasculature as a novel means of regulating allograft rejection. Circulation. 2003;107:1525–1531. - PubMed
    1. Askenasy N, Yolcu ES, Yaniv I, et al. Induction of tolerance using Fas ligand: a double-edged immunomodulator. Blood. 2005;105:1396–1404. - PubMed
    1. Bacchetta R, Gregori S, Roncarolo MG. CD4+ regulatory T cells: mechanisms of induction and effector function. Autoimmun Rev. 2005;4:491–496. - PubMed

Publication types