Fluorescence microscopy evidence for quasi-permanent attachment of antifreeze proteins to ice surfaces
- PMID: 17325008
- PMCID: PMC1853139
- DOI: 10.1529/biophysj.106.096297
Fluorescence microscopy evidence for quasi-permanent attachment of antifreeze proteins to ice surfaces
Abstract
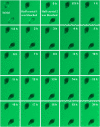
Many organisms are protected from freezing by the presence of extracellular antifreeze proteins (AFPs), which bind to ice, modify its morphology, and prevent its further growth. These proteins have a wide range of applications including cryopreservation, frost protection, and as models in biomineralization research. However, understanding their mechanism of action remains an outstanding challenge. While the prevailing adsorption-inhibition hypothesis argues that AFPs must bind irreversibly to ice to arrest its growth, other theories suggest that there is exchange between the bound surface proteins and the free proteins in solution. By conjugating green fluorescence protein (GFP) to a fish AFP (Type III), we observed the binding of the AFP to ice. This was accomplished by monitoring the presence of GFP-AFP on the surface of ice crystals several microns in diameter using fluorescence microscopy. The lack of recovery of fluorescence after photobleaching of the GFP component of the surface-bound GFP-AFP shows that there is no equilibrium surface-solution exchange of GFP-AFP and thus supports the adsorption-inhibition mechanism for this type of AFP. Moreover, our study establishes the utility of fluorescently labeled AFPs as a research tool for investigating the mechanisms underlying the activity of this diverse group of proteins.
Figures


Similar articles
-
When are antifreeze proteins in solution essential for ice growth inhibition?Langmuir. 2015 Jun 2;31(21):5805-11. doi: 10.1021/acs.langmuir.5b00345. Epub 2015 May 18. Langmuir. 2015. PMID: 25946514
-
Direct visualization of spruce budworm antifreeze protein interacting with ice crystals: basal plane affinity confers hyperactivity.Biophys J. 2008 Jul;95(1):333-41. doi: 10.1529/biophysj.107.125328. Epub 2008 Mar 13. Biophys J. 2008. PMID: 18339740 Free PMC article.
-
Superheating of ice crystals in antifreeze protein solutions.Proc Natl Acad Sci U S A. 2010 Mar 23;107(12):5423-8. doi: 10.1073/pnas.0909456107. Epub 2010 Mar 9. Proc Natl Acad Sci U S A. 2010. PMID: 20215465 Free PMC article.
-
Antifreeze Proteins and Their Practical Utilization in Industry, Medicine, and Agriculture.Biomolecules. 2020 Dec 9;10(12):1649. doi: 10.3390/biom10121649. Biomolecules. 2020. PMID: 33317024 Free PMC article. Review.
-
Properties, potentials, and prospects of antifreeze proteins.Crit Rev Biotechnol. 2008;28(1):57-82. doi: 10.1080/07388550801891152. Crit Rev Biotechnol. 2008. PMID: 18322856 Review.
Cited by
-
Microfluidic experiments reveal that antifreeze proteins bound to ice crystals suffice to prevent their growth.Proc Natl Acad Sci U S A. 2013 Jan 22;110(4):1309-14. doi: 10.1073/pnas.1213603110. Epub 2013 Jan 8. Proc Natl Acad Sci U S A. 2013. PMID: 23300286 Free PMC article.
-
Threonine side chain conformational population distribution of a type I antifreeze protein on interacting with ice surface studied via ¹³C-¹⁵N dynamic REDOR NMR.Solid State Nucl Magn Reson. 2011 Feb-Apr;39(1-2):7-13. doi: 10.1016/j.ssnmr.2011.03.002. Epub 2011 Mar 23. Solid State Nucl Magn Reson. 2011. PMID: 21470833 Free PMC article.
-
Divergent Mechanisms of Ice Growth Inhibition by Antifreeze Proteins.Methods Mol Biol. 2024;2730:169-181. doi: 10.1007/978-1-0716-3503-2_12. Methods Mol Biol. 2024. PMID: 37943458 Review.
-
Determining the ice-binding planes of antifreeze proteins by fluorescence-based ice plane affinity.J Vis Exp. 2014 Jan 15;(83):e51185. doi: 10.3791/51185. J Vis Exp. 2014. PMID: 24457629 Free PMC article.
-
Adsorption of ice-binding proteins onto whole ice crystal surfaces does not necessarily confer a high thermal hysteresis activity.Sci Rep. 2022 Sep 14;12(1):15443. doi: 10.1038/s41598-022-19803-3. Sci Rep. 2022. PMID: 36104389 Free PMC article.
References
-
- Yeh, Y., and R. E. Feeney. 1996. Antifreeze proteins: structures and mechanisms of function. Chem. Rev. 96:601–618. - PubMed
-
- DeVries, A. L. 1971. Glycoproteins as biological antifreeze agents in Antarctic fishes. Science. 172:1152–1155. - PubMed
-
- Tomchaney, A. P., J. P. Morris, S. H. Kang, and J. G. Duman. 1982. Purification, composition, and physical properties of a thermal hysteresis “antifreeze” protein from larvae of the beetle, Tenebrio molitor. Biochemistry. 21:716–721. - PubMed
Publication types
MeSH terms
Substances
LinkOut - more resources
Full Text Sources
Other Literature Sources

