. 2007 May 15;92(10):3719-28.
doi: 10.1529/biophysj.106.095398. Epub 2007 Feb 26.

(Un)confined diffusion of CD59 in the plasma membrane determined by high-resolution single molecule microscopy

Affiliations

(Un)confined diffusion of CD59 in the plasma membrane determined by high-resolution single molecule microscopy

Stefan Wieser et al. Biophys J. .

Abstract

There has been emerging interest whether plasma membrane constituents are moving according to free Brownian motion or hop diffusion. In the latter model, lipids, lipid-anchored proteins, and transmembrane proteins would be transiently confined to periodic corrals in the cell membrane, which are structured by the underlying membrane skeleton. Because this model is based exclusively on results provided by one experimental strategy--high-resolution single particle tracking--we attempted in this study to confirm or amend it using a complementary technique. We developed a novel strategy that employs single molecule fluorescence microscopy to detect confinements to free diffusion of CD59--a GPI-anchored protein--in the plasma membrane of living T24 (ECV) cells. With this method, minimum invasive labeling via fluorescent Fab fragments was sufficient to measure the lateral motion of individual protein molecules on a millisecond timescale, yielding a positional accuracy down to 22 nm. Although no hop diffusion was directly observable, based on a full analytical description our results provide upper boundaries for confinement size and strength.


Figures
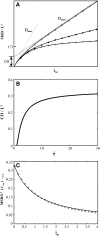
FIGURE 1
FIGURE 1
Principle of the analysis. (A) The mean square displacement as a function of the time-lag is shown for confined diffusion simulated using Monte Carlo algorithms. Simulations for formula image, 7.6, and 31 are shown as circles, dots, and stars, respectively. The full lines are drawn according to Eq. 2. The asymptotic behavior of MSD for short (long) time-lags defines the microscopic (macroscopic) diffusion constant Dmicro (Dmacro). The intersection of the asymptote for long time-lags (dashed line) with the y axis defines the confinement offset CO. (B) formula image increases with increasing confinement strength formula image and approximates 1/3. (C) Monte Carlo simulation of positional averaging due to totally confined diffusion during illumination. Trajectories of various lengths were simulated for random walk in impermeable corrals ( formula image). For each trajectory, the average position was determined, and its square distance from an independent second trajectory of the same length formula image was calculated (20,000 trajectories). The plot shows this value as a function of formula image, which is specified by the trajectory length. The full line shows the derived correction term formula image.
FIGURE 2
FIGURE 2
Determination of the saturation intensity for Alexa647-labeled antibodies. Fluorescent antibodies were immobilized to glass coverslips, and the fluorescence signal, N, was measured as a function of the excitation intensity I. The saturation intensity IS was determined according to formula image, yielding IS = 19 kW/cm2.
FIGURE 3
FIGURE 3
Test experiment on artificially moved 30-nm latex spheres immobilized to a glass coverslip. The stage was moved sinusoidally with a xy-piezo with an amplitude of L = 200 nm at a frequency of 10 Hz. Trajectories of individual beads were recorded at tlag = 50 ms, and the MSD was calculated. The lower value originates from the in-phase movement of the stage with the illumination protocol, resulting in a return of the particles to its start position after 100 ms; it therefore specifies the localization precision. The maximum value is given by the average square distance of two arbitrary points in a sine wave, formula image. We find here L = 170 nm, which agrees well with the applied setting.
FIGURE 4
FIGURE 4
Localization precision for single molecules. T24(ECV) cells were stained with fluorescent antibody to CD59, fixed with methanol/acetone (1:1), flushed with PBS, and single molecule trajectories were recorded for all applied experimental conditions. Here, an experiment is shown with till = 0.65 ms, tdelay = 0.4 ms. A linear fit yields an offset formula image, concomitant to a localization precision formula image.
FIGURE 5
FIGURE 5
Localization precision formula image for single CD59 molecules as a function of the signal brightness N, determined according to Fig. 4. The three data points indicate experiments performed at till = 0.05 ms (full antibody), till = 0.65 ms (Fab fragment) and till = 1.5 ms (Fab fragment). A theoretical derivation for the localization precision derived in Thompson et al. (26) was calculated using the measured values for the background noise, the width of the point spread function, the molecular brightness N, and the known pixel size of 200 nm (line), which perfectly describes the measured localization precision.
FIGURE 6
FIGURE 6
Movement of single fluorescently labeled CD59 molecules in a living T24(ECV) cell, shown in different magnifications. By fitting a two-dimensional Gaussian distribution to the intensity profile the actual single molecule positions were determined, exemplified here for one selected molecule; its trajectory over six consecutive images is shown in red, with the localization precision of 22 nm being indicated by the radius of the circle. Due to the short time-lag tlag = 1 ms, the trajectory hardly exceeds one pixel.
FIGURE 7
FIGURE 7
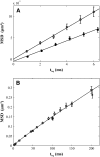
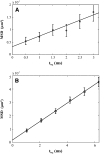
MSD as a function of the time-lag for Fab-labeled CD59 in T24(ECV) cells. Each dot represents the mean value of >100 individual square displacement steps, recorded on 10–20 different cells. All data are corrected for the localization precision formula image according to Eq. 4. (A) The movement of single CD59 molecules labeled with fluorescent Fab fragments was recorded with till = 0.3 ms (till = 0.65 ms) and tdelay = 0.7 ms (tdelay = 0.4 ms) at 37°C (20°C). The data were fitted by a linear increase according to Eq. 1, yielding a diffusion constant formula image (formula image) and a concomitant confinement offset formula image ( formula image) for experiments performed at 37°C shown as open circles (20°C shown as solid circles). (B) To test for confinement on larger length scales, experiments were repeated using time-lags of 15 ms (circles), 50 ms (squares), and 101 ms (stars). A fit based on the model of anomalous diffusion according to formula image reveals an anomalous diffusion coefficient d = 0.93.
FIGURE 8
FIGURE 8
MSD as a function of the time-lag for full Ab-labeled CD59 in T24(ECV) cells. To induce dimerization of CD59, cells were labeled with a fluorescent full antibody. Experiments were performed at 20°C (A) and 37°C (B), yielding formula image, formula image and formula image, formula image, respectively. In experiment A (B), the illumination was set to till = 50 μs (till = 0.65 ms); trajectories were recorded with a time-lag of 0.5 ms (1.05 ms).
FIGURE 9
FIGURE 9
Probability analysis of square displacements δr2. The cumulative probability distribution of δr2 was plotted for the data shown in Fig. 7 A (37°C, tlag = 1 ms) and fitted by a monoexponential function formula image describing free Brownian motion (20). No significant deviations were detectable. An expectation value formula image was calculated.
FIGURE 10
FIGURE 10
Estimation of a “forbidden region” in two-dimensional parameter space formula image. Based on Gaussian error propagation theory, we estimated for all experimental realizations the maximum values of the duplet formula image, which would be consistent with the experimental data in a one-sigma interval. All data shown in Table 2 were included and plotted according to the specified color code. See text for a detailed interpretation of this figure.

Similar articles

Cited by

References

    1. Sharma, P., R. Varma, R.C. Sarasij, Ira, K. Gousset, G. Krishnamoorthy, M. Rao, and S. Mayor. 2004. Nanoscale organization of multiple GPI-anchored proteins in living cell membranes. Cell 116:577–589. - PubMed
    1. Simons, K., and E. Ikonen. 1997. Functional rafts in cell membranes. Nature. 387:569–572. - PubMed
    1. Vereb, G., J. Szollosi, J. Matko, P. Nagy, T. Farkas, L. Vigh, L. Matyus, T. A. Waldmann, and S. Damjanovich. 2003. Dynamic, yet structured: the cell membrane three decades after the Singer-Nicolson model. Proc. Natl. Acad. Sci. USA. 100:8053–8058. - PMC - PubMed
    1. Munro, S. 2003. Lipid rafts: elusive or illusive? Cell. 115:377–388. - PubMed
    1. Douglass, A. D., and R. D. Vale. 2005. Single-molecule microscopy reveals plasma membrane microdomains created by protein-protein networks that exclude or trap signaling molecules in T cells. Cell. 121:937–950. - PMC - PubMed

Publication types

MeSH terms