. 2007 Mar;48(3):1087-94.
doi: 10.1167/iovs.06-1177.

Second-harmonic imaging microscopy of normal human and keratoconus cornea

Affiliations

Second-harmonic imaging microscopy of normal human and keratoconus cornea

Naoyuki Morishige et al. Invest Ophthalmol Vis Sci. 2007 Mar.

Abstract

Purpose: The purpose of this study was to evaluate the ability of second-harmonic imaging to identify differences in corneal stromal collagen organization between normal human and keratoconus corneas.

Methods: Six normal corneas from eye bank donors and 13 corneas of patients with keratoconus, obtained after penetrating keratoplasty were examined. A femtosecond titanium-sapphire laser with 800-nm output was used to generate second-harmonic signals collected at 400 nm from central and paracentral corneal tissue blocks. Three-dimensional (3-D) data sets were collected and reconstructed to evaluate the location and orientation of stromal collagen lamellae.

Results: Imaging of second-harmonic signals combined with 3-D reconstruction of the normal cornea identified a high degree of lamellar interweaving, particularly in the anterior cornea. Of note was the detection of lamellae that inserted into Bowman's layer and were oriented transverse to the corneal surface, penetrating posteriorly approximately 120 mum. In keratoconus corneas, imaging second-harmonic signals identified less lamellar interweaving and a marked reduction or loss of lamellae inserting into Bowman's layer in 12 of 13 cases, particularly in regions associated with cone development without breaks in Bowman's layer or scarring.

Conclusions: Compared with normal adult corneas, marked abnormalities were detected in the organization of the anterior corneal collagen lamellae of keratoconus corneas by second harmonic imaging. These structural abnormalities are consistent with the known changes in collagen organization and biomechanical strength of keratoconus.


Figures

Figure 1
Figure 1
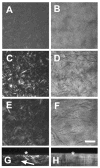
Second-harmonic signals from normal adult cornea detected with the forward (A, C, E, G) and backward (B, D, F, H) detector. (A, B) Bowman’s layer; (C, D) 10 μm below (A); (E, F) 50 μm below (A). (G) 3-D reconstruction of the data set from forward detector showing a maximum intensity projection rotated 90° in the y-axis through 230 μm of anterior stroma. (H,*) Bowman’s layer. Bar, 50 μm.
Figure 2
Figure 2
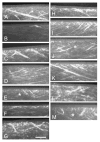
3-D reconstruction of data sets for all control, normal corneas from the forward and backward detectors showing maximum intensity projections rotated 90° in the y-axis. (AF) Images from donors aged 36, 38, 60, 81, 84, and 84 years, respectively. Bar , 50 μm.
Figure 3
Figure 3
Second-harmonic signals from keratoconus corneas detected with the forward (A, C, E, G) and backward (B, D, F, H) detector. (A, B) Bowman’s layer; (C, D) 10 μm below (A); (E, F) 50 μm below (A). (G) 3-D reconstruction of the data set from forward detector showing a maximum intensity projection rotated 90° in the y-axis through 230 μm of anterior stroma. Note that lamellae inserting into Bowman’s layer are absent (arrow) or shortened. (H) 3-D reconstruction of a 10-μm-thick slice through the data set from the backward detector showing a maximum intensity projection rotated 90° in the y-axis through 10 μm of anterior stroma. (*) Bowman’s layer. Bar, 50 μm.
Figure 4
Figure 4
3-D reconstruction of data sets for all 13 cases of keratoco-nus from the forward and backward detectors showing maximum intensity projections rotated 90° in the y-axis. (AM) Images from donors aged 19, 22, 23, 26, 32, 33, 34, 48, 49, 52, 56, 57, and 60 years, respectively. (*) Regions of disrupted lamellae inserting into Bowman’s layer. Bar, 50 μm.
Figure 5
Figure 5
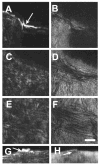
Second-harmonic signals from keratoconus cornea detected with the forward (A, C, E, G) and backward (B, D, F, H) detector in a region showing a break in Bowman’s layer. (A, B) Bowman’s layer; arrow: break with increased collagen deposition; (C, D) 10 μm below (A); (E, F) 50 μm below (A); (G) 3-D reconstruction of the data set from forward detector showing a maximum intensity projection rotated 90° in the y-axis through 230 μm of anterior stroma. Note absence of lamellae that insert into Bowman’s layer and increased collagen deposition at the break in Bowman’s layer (arrow). (H) 3-D reconstruction of a 10 × 230-μm slice through the data set from the backward detector showing a maximum intensity projection rotated 90° in the y-axis through a 10-μm cross section. Note absence of lamellar interweaving and disruption of lamellar organization at break (arrow). (*) Bowman’s layer. Bar, 50 μm.
Figure 6
Figure 6
3-D reconstruction of data sets showing forward and backward detected images of the eight cases of keratoconus with breaks in Bowman’s layer (between arrows: A, B, FH). Note the fibrosis above Bowman’s layer (B, *) and the absence of lamellae that insert into Bowman’s layer in all samples except (H), which shows loss of these lamellae underlying the break in Bowman’s layer (arrowhead). Epi, epithelium; BL, Bowman’s layer; Str, stroma. Bar, 50 μm.
Figure 7
Figure 7
Spatial relation between broken Bowman’s layer and corneal stromal cells showing forward (cyan) and backward (magenta) detected collagen, nuclei (red), and actin (green). (A) x-, z-Slice through the 3-D data set at the break in Bowman’s membrane (between arrows) showing collagen deposited at the break (*) with fibroblasts extending along the epithelial side of Bowman’s layer (arrowheads) and a gap between Bowman’s layer and the corneal epithelium (double-headed arrow). (B) x-, y-Plane showing fibroblasts appearing to migrate from fibrotic collagen deposited above Bowman’s layer (cells are same as those indicated in C at arrowheads). (C) x, y-Plane showing forward detected collagen signal at level of Bowman’s layer (indicated as BL). Note the deposition of collagen transverse to the break (arrowheads). (D) x, y-Plane showing backward detected collagen signal. Note collagen deposited along the break. Bar, 50 μm.

Similar articles

Cited by

References

    1. Campagnola PJ, Loew LM. Second-harmonic imaging microscopy for visualizing biomolecular arrays in cells, tissues and organisms. Nat Biotechnol. 2003;21:1356–1360. - PubMed
    1. Freund I, Deutsch M, Sprecher A. Connective tissue polarity: optical second-harmonic microscopy, crossed-beam summation, and small-angle scattering in rat-tail tendon. Biophys J. 1986;50:693–712. - PMC - PubMed
    1. Hochheimer BF. Second harmonic light generation in the rabbit cornea. Appl Opt. 1982:1516–1518. - PubMed
    1. Mohler W, Millard AC, Campagnola PJ. Second harmonic generation imaging of endogenous structural proteins. Methods. 2003;29:97–109. - PubMed
    1. Teng SW, Tan HY, Peng JL, et al. Multiphoton autofluorescence and second-harmonic generation imaging of the ex vivo porcine eye. Invest Ophthalmol Vis Sci. 2006;47:1216–1224. - PubMed

Publication types