. 2007 Mar 26;96(6):896-902.
doi: 10.1038/sj.bjc.6603648. Epub 2007 Feb 27.

Chemotherapy in advanced biliary tract carcinoma: a pooled analysis of clinical trials

Affiliations

Chemotherapy in advanced biliary tract carcinoma: a pooled analysis of clinical trials

F Eckel et al. Br J Cancer. .

Abstract

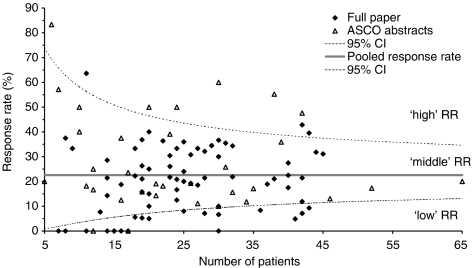
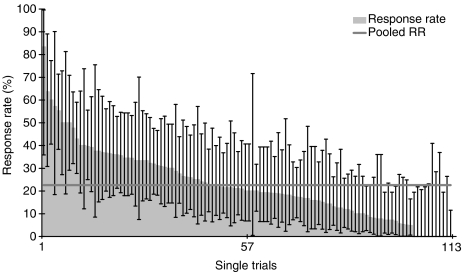
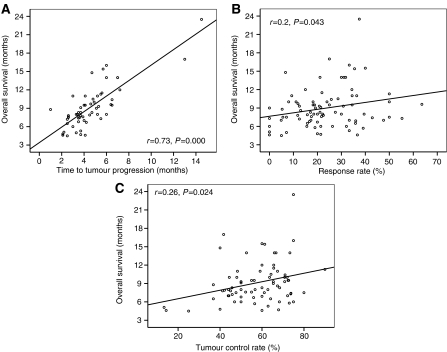
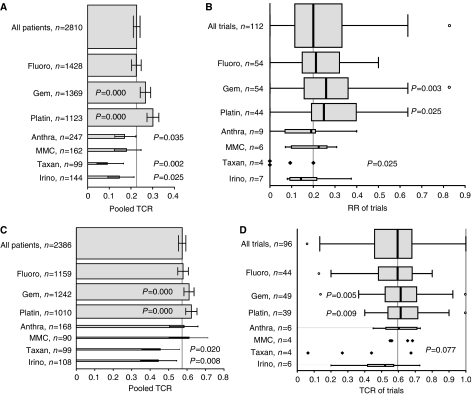
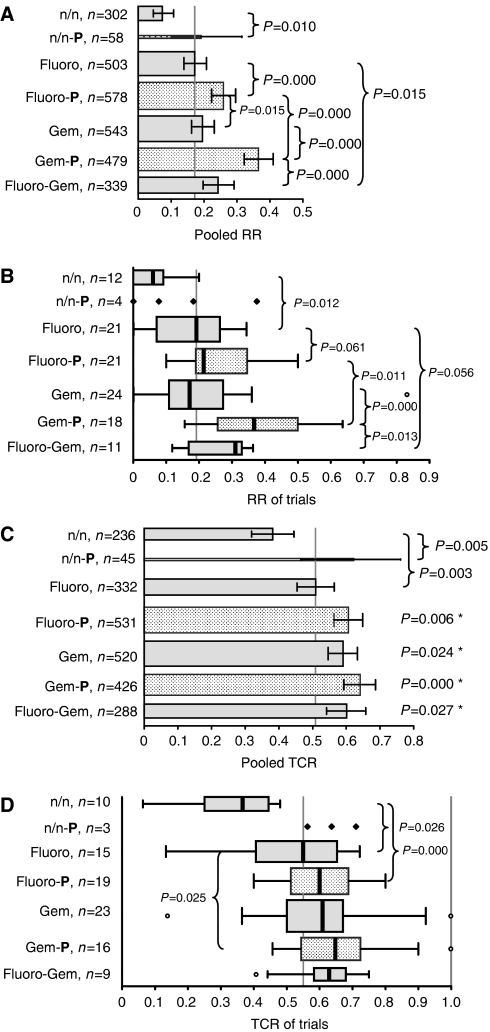
Owing to the lack of randomised controlled trials no standard of chemotherapy exists in the treatment of advanced biliary tract carcinoma. 5-fluorouracil or gemcitabine is recommended based on small and predominately phase II trials. The aim of this analysis was to analyse existing trials, even small and nonrandomised, and identify superior regimens. Chemotherapy trials published in English from 1985 to July 2006 were analysed as well as ASCO abstracts from 1999 to 2006. Response rate (RR=CR+PR), tumour control rate (TCR=CR+PR+SD), time to tumour progression (TTP), overall survival (OS), and toxicity were analysed. One hundred and four trials comprising 112 trial arms and 2810 patients, thereof 634 responders and 1368 patients with tumour control were analysed. Pooled RR and TCR were 22.6 and 57.3%, respectively. Significant correlations of RR and TCR with survival times were found. Subgroup analysis showed superior RRs for gallbladder carcinoma (GBC) compared with cholangiocarcinoma, but shorter OS for GBC. Furthermore, superior RRs and TCRs of gemcitabine and platinum containing regimens were found with highest RRs and TCRs in the combination subgroup. Based on published results of predominately phase II trials, gemcitabine combined with platinum compounds represents the provisional standard of chemotherapy in advanced biliary tract cancer, unless a new evidence-based standard has been defined.


Figures

Figure 1
Figure 1
Response rates of all trials analysed sorted by the number of patients. Full papers are indicated by black rhombi and ASCO abstracts by empty triangles. The horizontal grey line represents the pooled response rate of all patients (22.6%). The limits of the 95% CI of the overall pooled RR are shown by doted lines.
Figure 2
Figure 2
Response rate and 95% CI of all trials analysed sorted by the RR. The horizontal grey represents the pooled RR of all patients (22.6%).
Figure 3
Figure 3
(AC) Charts showing the correlation between RR, TCR, TTP and OS.
Figure 4
Figure 4
(AD) Fluoro: fluoropyrimidines (fluorouracil, capecitabine, tegafur); Gem: gemcitabine; Platin: platinum compounds (cisplatin, oxaliplatin, carboplatin); Anthra: anthracyclines (adriamycin, epirubicin); MMC: mitomycin C; Taxan: taxanes (paclitaxel, docetaxel), Irino: irinotecan. (A) Pooled RRs (RR=CR+PR) and 95% CIs of all patients included in the analysis and of subgroups of patients, defined by treatment with regimens containing a particular drug regardless of other drugs. The height of the bars correlates with the number of patients. The P-values apply to the comparison of a subgroup, defined by a particular drug vs all other patients, which were not treated with this drug (e.g., patients treated with gemcitabine or gemcitabine-containing combinations vs patients treated with gemcitabine-free regimens). The RRs of the comparison subgroups are not shown. The vertical grey line represents the pooled RR of all patients (pts, 22.6%). (B) Boxplots of the RRs of all trials and of subgroups, defined by a particular drug. The height of the boxplots correlates with the number of trials. P-values for subgroup comparison as in Figure 3A. The vertical grey line represents the median RR of all trials (20.0%). For subgroups consisting of less than five trials, results of single trial are shown and no boxplots are provided. (C) Pooled TCRs (TCR=CR+PR+SD) and 95% CIs as in Figure 3A. The vertical grey line represents the pooled TCR of all patients (57.3%). (D) Boxplots of the TCRs as in Figure 3B. The vertical grey line represents the median TCR of all trials (59.6%).
Figure 5
Figure 5
(AD) Fluoro: n/n: neither Fluoro nor Gem; Fluoro: fluoropyrimidines (fluorouracil, capecitabine, tegafur); Gem: gemcitabine; P: platinum compounds (cisplatin, oxaliplatin, carboplatin). (A) Pooled RRs (RR=CR+PR) and 95% CIs of subgroups of patients, defined by treatment with fluoropyrimidines, gemcitabine, and platinum compounds, regardless of other drugs. The height of the bars correlates with the number of patients. The vertical grey line represents the pooled RR of the Fluoro subgroup (17.1%). The Fluoro-Gem-P subgroup consists of only eight patients and is therefore not shown. Additional P-values: Fluoro vs Gem-P: 0.000; n/n vs all other subgroups: 0.000; n/n-P vs Gem-P: 0.012. (B) Boxplots of RRs of subgroups of trials, defined by treatment with fluoropyrimidines, gemcitabine, and platinum compounds. The height of he boxplots correlates with the number of trials. The vertical grey line represents the median RR of the Fluoro subgroup (19.2%). The Fluoro-Gem-P subgroup consists of only one trial and is therefore not shown. For subgroups consisting of less than five trials, results of single trial are shown and no boxplots are provided. Additional P-values: Fluoro vs Gem-P: 0.000; Fluoro-P vs Gem: 0.033; n/n vs all other subgroups: ⩽0.002; n/n-P vs Gem-P: 0.042. (C) Pooled TCRs (TCR=CR+PR+SD) and 95% CIs of subgroups of patients as in Figure 4A. The vertical grey line represents the pooled TCR of the Fluoro subgroup (50.9%). *P-value in comparison to the Fluoro subgroup. Additional P-values: n/n vs all other subgroups: 0.000. (D) Boxplots of TCRs of subgroups of trials as in Figure 4C. The vertical grey line represents the median RR of the Fluoro subgroup (55.0%). Additional P-values: n/n vs all other subgroups: ⩽0.003.

Similar articles

Cited by

References

    1. de Groen PC, Gores GJ, LaRusso NF, Gunderson LL, Nagorney DM (1999) Biliary tract cancers. N Engl J Med 341: 1368–1378 - PubMed
    1. Djulbegovic B, Frohlich A, Bennett CL (2005) Acting on imperfect evidence: how much regret are we ready to accept? J Clin Oncol 23: 6822–6825 - PubMed
    1. Ducreux M, Van Cutsem E, Van Laethem JL, Gress TM, Jeziorski K, Rougier P, Wagener T, Anak O, Baron B, Nordlinger B (2005) A randomised phase II trial of weekly high-dose 5-fluorouracil with and without folinic acid and cisplatin in patients with advanced biliary tract carcinoma: results of the 40955 EORTC trial. Eur J Cancer 41: 398–403 - PubMed
    1. Khan SA, Davidson BR, Goldin R, Pereira SP, Rosenberg WM, Taylor-Robinson SD, Thillainayagam AV, Thomas HC, Thursz MR, Wasan H (2002) Guidelines for the diagnosis and treatment of cholangiocarcinoma: consensus document. Gut 51(Suppl 6): VI1–VI9 - PMC - PubMed
    1. Khan SA, Thomas HC, Davidson BR, Taylor-Robinson SD (2005) Cholangiocarcinoma. Lancet 366: 1303–1314 - PubMed

MeSH terms