. 2007 Jan;9(1):57-67.
doi: 10.1593/neo.06688.

Impact of stroma on the growth, microcirculation, and metabolism of experimental prostate tumors

Affiliations

Impact of stroma on the growth, microcirculation, and metabolism of experimental prostate tumors

Christian M Zechmann et al. Neoplasia. 2007 Jan.

Abstract

In prostate cancers (PCa), the formation of malignant stroma may substantially influence tumor phenotype and aggressiveness. Thus, the impact of the orthotopic and subcutaneous implantations of hormone-sensitive (H), hormone-insensitive (HI), and anaplastic (AT1) Dunning PCa in rats on growth, microcirculation, and metabolism was investigated. For this purpose, dynamic contrast-enhanced magnetic resonance imaging and (1)H magnetic resonance spectroscopy ([(1)H]MRS) were applied in combination with histology. Consistent observations revealed that orthotopic H tumors grew significantly slower compared to subcutaneous ones, whereas the growth of HI and AT1 tumors was comparable at both locations. Histologic analysis indicated that glandular differentiation and a close interaction of tumor cells and smooth muscle cells (SMC) were associated with slow tumor growth. Furthermore, there was a significantly lower SMC density in subcutaneous H tumors than in orthotopic H tumors. Perfusion was observed to be significantly lower in orthotopic H tumors than in subcutaneous H tumors. Regional blood volume and permeability-surface area product showed no significant differences between tumor models and their implantation sites. Differences in growth between subcutaneous and orthotopic H tumors can be attributed to tumor-stroma interaction and perfusion. Here, SMC, may stabilize glandular structures and contribute to the maintenance of differentiated phenotype.


Figures

Figure 1
Figure 1
Study plan. The study plan includes the number of animals in which H, HI, and AT1 tumors were implanted and the number of implantations that led to successful tumor growth (take rate in brackets). Bottom line: Time intervals of examinations with MRI.
Figure 2
Figure 2
Acceleration of tumor growth. Growth of H, HI, and AT1 tumors after orthotopic placement (closed line) and subcutaneous placement (dotted line). Differentiated H tumors showed the slowest growth rates, whereas anaplastic AT1 tumors displayed the fastest growth rates. Comparing tumor growth after orthotopic and subcutaneous implantations, orthotopic H tumors showed retarded growth (P < .05, starting on day 11), whereas orthotopic HI tumors exhibited accelerated growth. Differences in the growth rates of orthotopic and subcutaneous AT1 tumors were not significant. Note: The decline of the growth curve of orthotopic AT1 tumors on day 17 resulted from the removal of three animals with symptomatic disease.
Figure 3
Figure 3
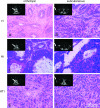
HE staining of Dunning PCa. Images of HE-stained orthotopic tumors (A, C, E) and subcutaneous (B, D, F) H tumors (A and B), HI tumors (C and D), and AT1 tumors (E and F). The corresponding T2w MR images are supplemented on the upper left part of each image. Tumors are labeled with arrows. The loss of differentiation from H tumors, to HI tumors, to AT1 tumors is visible. Orthotopic H tumors are highly differentiated and show tubular structures. (A) Dedifferentiated areas, however, are frequently found in subcutaneous H tumors. (B) HI tumors (C and D) secrete mucin, which is found in large lacunes mimicking tubular structures. AT1 tumors (E and F) have an anaplastic phenotype without distinct resemblance to the tissue of origin. Both HI tumors (C and D) and AT1 tumors (E and F) do not show marked differences for the two implantation sites. Bar = 100 µm.
Figure 4
Figure 4
Results from immunostaining. Plots of mean positive area fractions of SMA, TUNEL, CD31, and Ng-2 (± standard deviation) in orthotopic and subcutaneous PCa of H, HI, and AT1 sublines. SMA area fractions decreased from H tumors to AT1 tumors and have significantly higher values in orthotopic H tumors compared with all other tumors and subcutaneous H tumors with subcutaneous HI tumors and both AT1 tumors. Differences between orthotopic HI tumors and both AT1 tumors, as well as subcutaneous HI tumors and orthotopic AT1 tumors, were also significant. According to TUNEL staining, no significant differences were observed between the three tumor sublines in orthotopic and subcutaneous locations. Vessel density (CD31) was significantly higher in orthotopic H tumors as in subcutaneous H and AT1 tumors. Ng-2 decreased from H tumors, to HI tumors, to AT1 tumors without showing significant differences between the orthotopic and subcutaneous implantation sites of the same subline, but with significant decrease between both H tumors and both AT1 tumors. *P < .05.
Figure 5
Figure 5
Triple-immunofluorescence images of CD31, Ng-2, and DAPI of H, HI, and AT1 tumor sections. Ng-2 (green) colocalized with CD31-positive (red) vessels but could not be found on the surface of tumor cells. Furthermore, comparing H tumors (A and B) with HI tumors (C and D) and AT1 tumors (E and F) at both location sites, a significant decrease in the amount of Ng-2-positive vessels was observed. No significant difference was found on comparing subcutaneous and orthotopic tumors. The triple-immunofluorescence images of CD31 (red), SMA (green), and DAPI (blue) of H, HI, and AT1 tumor sections are shown in (G) to (L). In orthotopic H tumors, most SMAs localized around glandular tumor islets, and only minor amounts were associated with CD31-positive vessels. In subcutaneous H tumors, the association of SMC and tumor cells decreased, and the surroundings of tubular tumor cell specifications were frequently incomplete or absent (arrows). In HI and AT1 tumors, SMA was predominantly found along vascular structures, which is true for both implantation sites. Almost no direct association of glandular tumor cell islets and SMC could be observed. Bar = 100 µm.
Figure 6
Figure 6
Concentration-time courses from DCE-MRI. The concentration-time courses were averaged over tumors within each of the six groups. Higher concentrations of the contrast agent compared to their orthotopic counterparts are accumulated in subcutaneous tumors.
Figure 7
Figure 7
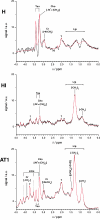
[1H]MRS of subcutaneous Dunning PCa. Localized in vivo [1H]MR spectra of subcutaneous H, HI, and anaplastic AT1 tumors [PRESS technique: water signal suppression, TR = 2000 milliseconds, TE = 14 milliseconds, number of excitations = 128, voxel size = 4 x 4 x 4 mm3, planar surface coil B0 = 9.4 T]. The chemical shift scale (δ) could be fixed by identification of the peaks of >N-CH3 protons of Cr (H and AT1) and of methylene and methyl protons of lipids (Lip) (HI and AT1). Analysis of the multiline spectrum of AT1 tumors yielded the signal of methylene protons of Cr at δ = 3.9 ppm, whereas the resonance at δ = 3.2 ppm appeared as a superposition of the N-trimethyl proton signal of Cho and a signal at about 3.25 ppm (shoulder at the low-field side). This signal, together with the peaks at δ = 3.52 and 4.1, was tentatively assigned to myo-inositol (mIns) using chemical shifts (δ = 3.28, 3.52, 3.62, and 4.06 ppm) measured at B0 = 7.0 T for mIns model solution [37]. Inspection of the spectrum of H tumors led to the assignment of two peaks of equal intensity at about 3.2 ppm (with possible signal contribution of Cho) and 3.4 ppm (measured chemical shift difference: 0.17 ppm) to Tau when referring to shifts δ = 3.26 ppm (triplet) and 3.43 ppm (triplet) observed in a Tau model solution at B0 = 7.0 T [37]. Tau was observed in all three spectra. The peaks at δ = 2.05 (resolved in all spectra) and 3.75 ppm (HI and AT1) with varying intensities could not be assigned unambiguously.

Similar articles

Cited by

References

    1. Rich AR. On the frequency of occurrence of occult carcinoma of the prostate. J Urol. 1935;33:215–223.
    1. Yatani R, Chigusa I, Akazaki K, Stemmermann GN, Welsh RA, Correa P. Geographic pathology of latent prostatic carcinoma. Int J Cancer. 1982;29:611–616. - PubMed
    1. Silverberg E, Lubera JA. Cancer statistics 1989. CA Cancer J Clin. 1989;39:3–30. - PubMed
    1. Etzioni R, Penson DF, Legler LM, di Tommaso D, Boer R, Gann PH, Feuer EJ. Overdiagnosis due to prostate-specific-antigen screening: lesson from US prostate cancer incidence trend. J Natl Cancer Inst. 2002;94:981–990. - PubMed
    1. Nelson WG, De Marzo AM, Isaacs WB. Prostate cancer. N Engl J Med. 2003;349:366–381. - PubMed