

Telomere attrition in isolated high-grade prostatic intraepithelial neoplasia and surrounding stroma is predictive of prostate cancer
- PMID: 17325746
- PMCID: PMC1803037
- DOI: 10.1593/neo.06745
Telomere attrition in isolated high-grade prostatic intraepithelial neoplasia and surrounding stroma is predictive of prostate cancer
Abstract
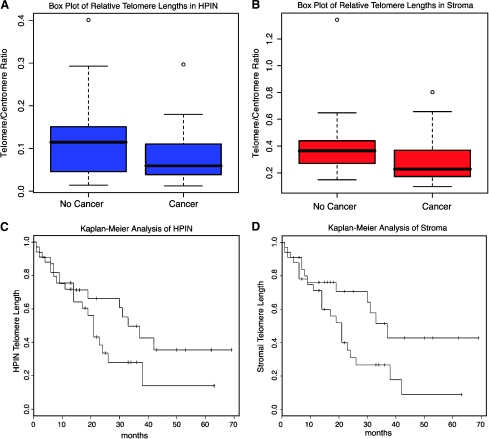
The causes of early genomic events underlying the development of prostate cancer (CaP) remain unclear. The onset of chromosomal instability is likely to facilitate the formation of crucial genomic aberrations both in the precursor lesion high-grade prostatic intraepithelial neoplasia (HPIN) and in CaP. Instability generated by telomere attrition is one potential mechanism that could initiate chromosomal rearrangements. In this study, normalized telomere length variation was examined in a cohort of 68 men without CaP who had HPIN only on prostatic biopsies. Multiple significant associations between telomere attrition and eventual diagnosis of CaP in the HPIN and in the surrounding stroma were found. Kaplan-Meier analysis of telomere length demonstrated a significantly increased risk for the development of cancer with short telomeres in the surrounding stroma [P = .035; hazard ratio (HR) = 2.12; 95% confidence interval (95% CI) = 0.231-0.956], and a trend for HPIN itself (P = .126; HR = 1.72; 95% CI = 0.287-1.168). Cox regression analysis also demonstrated significance between the time from the original biopsy to the diagnosis of cancer and telomere length in HPIN and in the surrounding stroma. These analyses showed significance, both alone and in combination with baseline prostate-specific antigen, and lend support to the hypothesis that telomere attrition in prostatic preneoplasia may be fundamental to the generation of chromosomal instability and to the emergence of CaP.
Figures
Similar articles
-
Evidence of multifocality of telomere erosion in high-grade prostatic intraepithelial neoplasia (HPIN) and concurrent carcinoma.Oncogene. 2003 Apr 3;22(13):1978-87. doi: 10.1038/sj.onc.1206227. Oncogene. 2003. PMID: 12673203
-
Topographical analysis of telomere length and correlation with genomic instability in whole mount prostatectomies.Prostate. 2011 May 15;71(7):778-90. doi: 10.1002/pros.21294. Epub 2010 Oct 28. Prostate. 2011. PMID: 21031437
-
Identification of numerical chromosomal changes detected by interphase fluorescence in situ hybridization in high-grade prostate intraepithelial neoplasia as a predictor of carcinoma.Arch Pathol Lab Med. 2002 Feb;126(2):165-9. doi: 10.5858/2002-126-0165-IONCCD. Arch Pathol Lab Med. 2002. PMID: 11825111
-
Preneoplasia in the prostate gland with emphasis on high grade prostatic intraepithelial neoplasia.Pathology. 2013 Apr;45(3):251-63. doi: 10.1097/PAT.0b013e32835f6134. Pathology. 2013. PMID: 23478231 Review.
-
Repeat biopsy strategy in patients with atypical small acinar proliferation or high grade prostatic intraepithelial neoplasia on initial prostate needle biopsy.J Urol. 2001 Sep;166(3):866-70. J Urol. 2001. PMID: 11490235 Review.
Cited by
-
Telomere DNA content in prostate biopsies predicts early rise in prostate-specific antigen after radical prostatectomy for prostate cancer.Urology. 2010 Mar;75(3):724-9. doi: 10.1016/j.urology.2009.04.032. Epub 2009 Jul 16. Urology. 2010. PMID: 19615720 Free PMC article.
-
Understanding and targeting prostate cancer cell heterogeneity and plasticity.Semin Cancer Biol. 2022 Jul;82:68-93. doi: 10.1016/j.semcancer.2021.11.001. Epub 2021 Nov 26. Semin Cancer Biol. 2022. PMID: 34844845 Free PMC article. Review.
-
Markers of field cancerization: proposed clinical applications in prostate biopsies.Prostate Cancer. 2012;2012:302894. doi: 10.1155/2012/302894. Epub 2012 May 14. Prostate Cancer. 2012. PMID: 22666601 Free PMC article.
-
The association between leukocyte telomere length and cigarette smoking, dietary and physical variables, and risk of prostate cancer.Aging Cell. 2009 Aug;8(4):405-13. doi: 10.1111/j.1474-9726.2009.00485.x. Epub 2009 Jun 1. Aging Cell. 2009. PMID: 19493248 Free PMC article.
-
Molecular genetics of prostate cancer: new prospects for old challenges.Genes Dev. 2010 Sep 15;24(18):1967-2000. doi: 10.1101/gad.1965810. Genes Dev. 2010. PMID: 20844012 Free PMC article. Review.
References
-
- The American Cancer Society, author. Cancer Facts and Figures, 2006. 2006. Available from http://www.cancer.org/downloads/STT/CAFF2006PWSecured.pdf (cited May 23, 2006)
-
- Canadian Cancer Society and National Cancer Institute of Canada, author. Canadian Cancer Statistics 2006. 2006. Available from http://129.33.170.32/vgn/images/portal/cit_86751114/31/21/935505792cw_20... (cited May 23, 2006)
-
- Qian J, Wollan P, Bostwick DG. The extent and multicentricity of high-grade prostatic intraepithelial neoplasia in clinically localized prostatic adenocarcinoma. Hum Pathol. 1997;28(2):143–148. - PubMed
-
- Sakr WA, Grignon DJ, Crissman JD, Heilbrun LK, Cassin BJ, Pontes JJ, Haas GP. High grade prostatic intraepithelial neoplasia (HGPIN) and prostatic adenocarcinoma between the ages of 20-69: an autopsy study of 249 cases. In Vivo. 1994;8(3):439–443. - PubMed
-
- Sakr WA, Haas GP, Cassin BF, Pontes JE, Crissman JD. The frequency of carcinoma and intraepithelial neoplasia of the prostate in young male patients. J Urol. 1993;150(2 (Pt 1)):379–385. - PubMed
Publication types
MeSH terms
LinkOut - more resources
Full Text Sources
Medical
Miscellaneous