

Imaging techniques for small animal imaging models of pulmonary disease: micro-CT
- PMID: 17325973
- PMCID: PMC2094132
- DOI: 10.1080/01926230601184262
Imaging techniques for small animal imaging models of pulmonary disease: micro-CT
Abstract
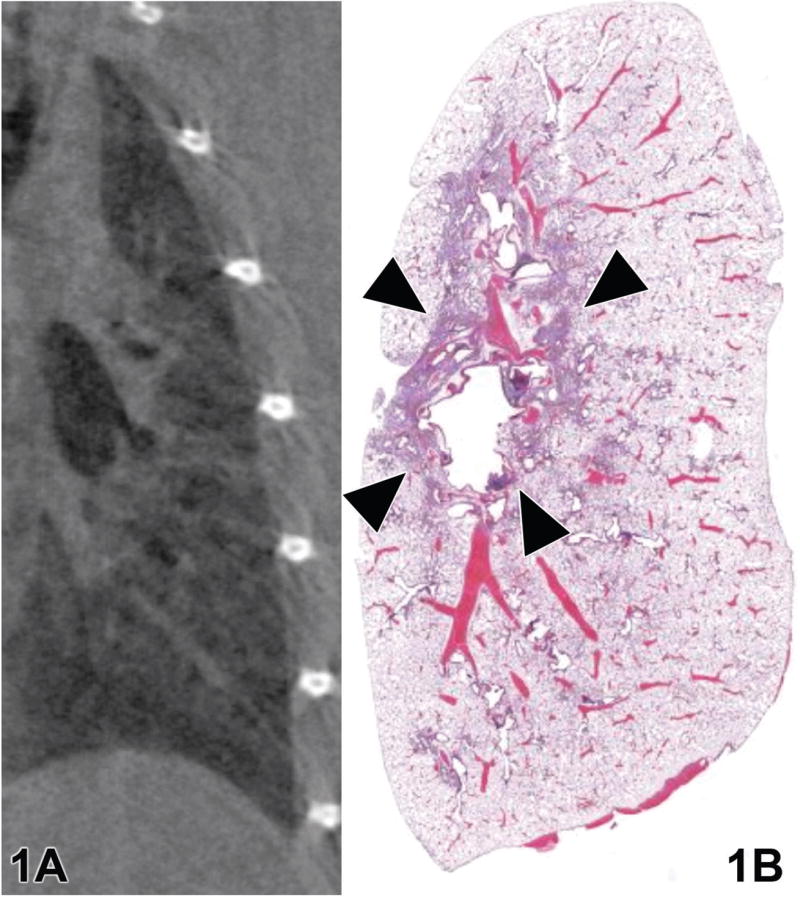
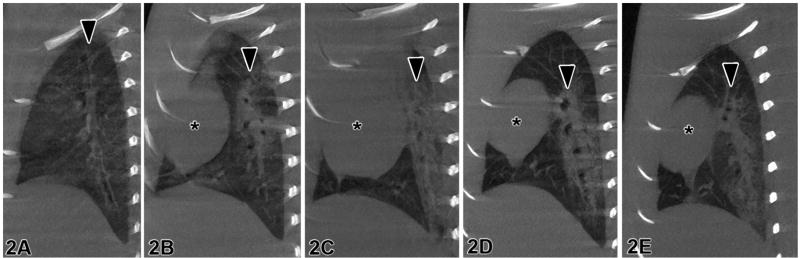
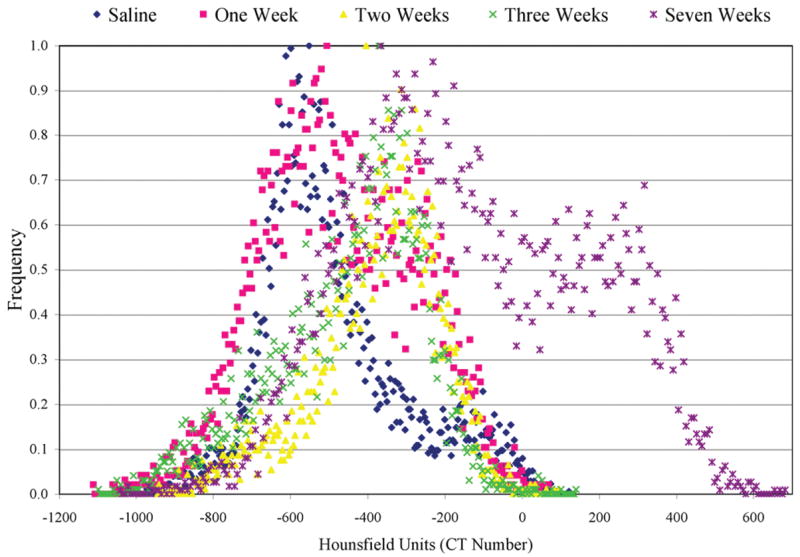
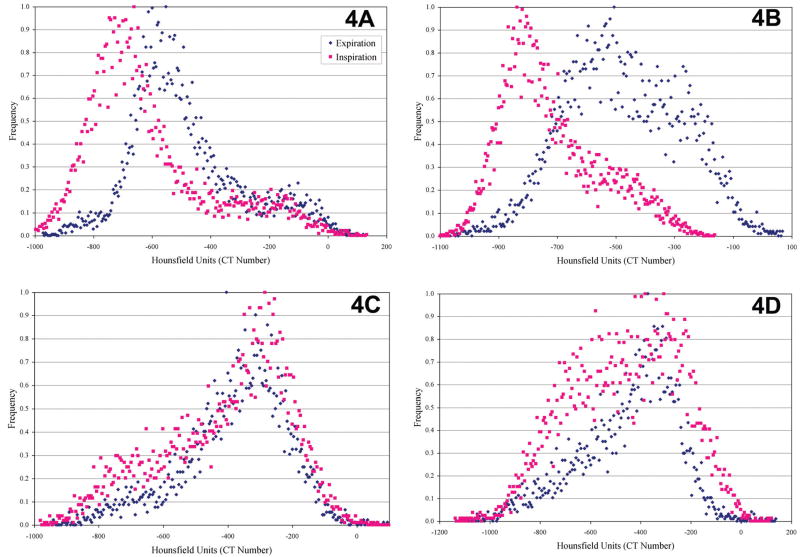
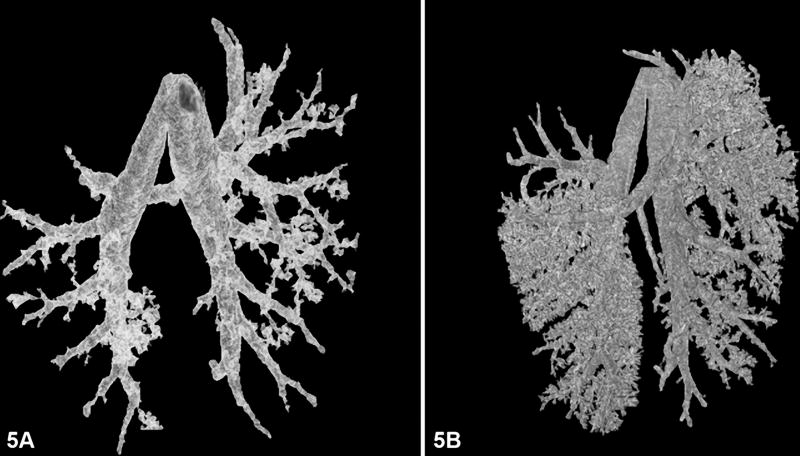
Microcomputed tomography (micro-CT) is ideal for quantifying pulmonary disease because of the inherent contrast between tissue and air that exists in the lungs. Both in vivo and in vitro studies can be performed using micro-CT. Live animal studies show function, while fixed specimen studies show structure. Through the use of image processing techniques, both acute and chronic lung diseases can be quantified. The information provided by micro-CT is complementary to histological evaluation, since CT is nondestructive. This paper discusses two examples, in vivo and in vitro, of how micro-CT can be used to assess pulmonary diseases in small animal models. With the use of micro-CT, we were able to quantify pulmonary fibrosis in the live rat and investigate the microstructure of the airway in fixed mouse lungs.
Figures
Similar articles
-
Quantification of bleomycin-induced murine lung damage in vivo with micro-computed tomography.Acad Radiol. 2006 Dec;13(12):1505-12. doi: 10.1016/j.acra.2006.08.011. Acad Radiol. 2006. PMID: 17138119
-
Semiquantitative measurement of murine bleomycin-induced lung fibrosis in in vivo and postmortem conditions using microcomputed tomography: correlation with pathologic scores--initial results.Invest Radiol. 2008 Jun;43(6):453-60. doi: 10.1097/RLI.0b013e31816900ec. Invest Radiol. 2008. PMID: 18496052
-
Quantitative micro-CT-derived biomarkers elucidate age-related lung fibrosis in elder mice.Respir Res. 2024 Oct 30;25(1):393. doi: 10.1186/s12931-024-03006-7. Respir Res. 2024. PMID: 39478545 Free PMC article.
-
[Thoracic CT: comparative study of CT imaging of peripheral lung lesions with fixed lung specimens].Rinsho Hoshasen. 1986 Oct;31(11):1345-55. Rinsho Hoshasen. 1986. PMID: 3546855 Review. Japanese. No abstract available.
-
Noninvasive imaging of experimental lung fibrosis.Am J Respir Cell Mol Biol. 2015 Jul;53(1):8-13. doi: 10.1165/rcmb.2015-0032TR. Am J Respir Cell Mol Biol. 2015. PMID: 25679265 Free PMC article. Review.
Cited by
-
Pulmonary abnormalities in mice with paracoccidioidomycosis: a sequential study comparing high resolution computed tomography and pathologic findings.PLoS Negl Trop Dis. 2010 Jun 29;4(6):e726. doi: 10.1371/journal.pntd.0000726. PLoS Negl Trop Dis. 2010. PMID: 20614019 Free PMC article.
-
Microcomputed tomography visualization and quantitation of the pulmonary arterial microvascular tree in mouse models of chronic lung disease.Pulm Circ. 2023 Aug 27;13(3):e12279. doi: 10.1002/pul2.12279. eCollection 2023 Jul. Pulm Circ. 2023. PMID: 37645586 Free PMC article.
-
A new method for respiratory gating during microcomputed tomography of lung in mice.J Am Assoc Lab Anim Sci. 2008 Jul;47(4):46-56. J Am Assoc Lab Anim Sci. 2008. PMID: 18702451 Free PMC article.
-
An optimized CT-dense agent perfusion and micro-CT imaging protocol for chick embryo developmental stages.BMC Biomed Eng. 2024 Apr 23;6(1):3. doi: 10.1186/s42490-024-00078-w. BMC Biomed Eng. 2024. PMID: 38654382 Free PMC article.
-
Dual-energy micro-CT of the rodent lung.Am J Physiol Lung Cell Mol Physiol. 2012 May 15;302(10):L1088-97. doi: 10.1152/ajplung.00359.2011. Epub 2012 Mar 16. Am J Physiol Lung Cell Mol Physiol. 2012. PMID: 22427526 Free PMC article.
References
-
- Bushberg JT, Seibert JA, Leidholdt EM, Boone JM. Essential Physics of Medical Imaging. 2. Williams and Wilkins; Baltimore, MD: 1994.
-
- Cavanaugh D, Johnson E, Price RE, Kurie J, Travis EL, Cody DD. In vivo respiratory-gated micro-CT imaging in small-animal oncology models. Mol Imaging. 2004;3:55–62. - PubMed
-
- Chaturvedi A, Lee Z. Three-dimensional segmentation and skeletonization to build an airway tree data structure for small animals. Phys Med Biol. 2005;50:1405–19. - PubMed
-
- Ford NL, Thornton MM, Holdsworth DW. Fundamental image quality limits for microcomputed tomography in small animals. Med Phys. 2003;30:2869–77. - PubMed
