. 2007 Feb 27:8:8.
doi: 10.1186/1471-2121-8-8.

Tissue and subcellular distribution of CLIC1

Affiliations

Tissue and subcellular distribution of CLIC1

Barbara Ulmasov et al. BMC Cell Biol. .

Abstract

Background: CLIC1 is a chloride channel whose cellular role remains uncertain. The distribution of CLIC1 in normal tissues is largely unknown and conflicting data have been reported regarding the cellular membrane fraction in which CLIC1 resides.

Results: New antisera to CLIC1 were generated and were found to be sensitive and specific for detecting this protein. These antisera were used to investigate the distribution of CLIC1 in mouse tissue sections and three cultured cell lines. We find CLIC1 is expressed in the apical domains of several simple columnar epithelia including glandular stomach, small intestine, colon, bile ducts, pancreatic ducts, airway, and the tail of the epididymis, in addition to the previously reported renal proximal tubule. CLIC1 is expressed in a non-polarized distribution in the basal epithelial cell layer of the stratified squamous epithelium of the upper gastrointesitinal tract and the basal cells of the epididymis, and is present diffusely in skeletal muscle. Distribution of CLIC1 was examined in Panc1 cells, a relatively undifferentiated, non-polarized human cell line derived from pancreatic cancer, and T84 cells, a human colon cancer cell line which can form a polarized epithelium that is capable of regulated chloride transport. Digitonin extraction was used to distinguish membrane-inserted CLIC1 from the soluble cytoplasmic form of the protein. We find that digitonin-resistant CLIC1 is primarily present in the plasma membrane of Panc1 cells. In T84 cells, we find digitonin-resistant CLIC1 is present in an intracellular compartment which is concentrated immediately below the apical plasma membrane and the extent of apical polarization is enhanced with forskolin, which activates transepithelial chloride transport and apical membrane traffic in these cells. The sub-apical CLIC1 compartment was further characterized in a well-differentiated mouse renal proximal tubule cell line. The distribution of CLIC1 was found to overlap that of megalin and the sodium-phosphate cotransporter, NaPi-II, which are markers of the apical endocytic/recycling compartment in proximal tubule.

Conclusion: The cell and tissue specific patterns of CLIC1 expression suggest it may play distinct roles in different cell types. In certain polarized columnar epithelia, it may play a role in apical membrane recycling.


Figures

Figure 1
Figure 1
Characterization of antibodies. A. Lysates of bacteria expressing glutathione-S-transferase (GST, lane 1) or GST-CLIC1 (lane 2), GST-CLIC4 (lane 3) or GST-CLIC5 (lane 4) fusion proteins were separated by SDS-PAGE and stained with Coomassie blue. Lane M contains molecular mass standards of 96, 66, 45, 31, and 21 kDa. B. Gel identical to that shown in panel A, blotted and probed with AP1089. C. Gel as in B, probed with 9F5. D. Mouse kidney microsomal membranes (lane 1) or whole cell lysates from Panc1 cells (lane 2), HELA cells (lane 3) or HELA cells overexpressing exogenous CLIC1 (lane 4) were separated on a 10% SDS-polyacrylamide gel, blotted, and probed with AP1089. Sample lanes each contained 30 μg of protein. Migration positions of molecular mass standards of 96, 66, 45, and 31 kDa are indicated. E. Whole cell lysates from Panc1 cells (lane 1), T84 cells (lane 2) or mouse kidney microsomal membranes (lane 3) were separated on 12% SDS-polyacrylamide gels, blotted, and probed with 9F5 monoclonal antibody. Lanes contain 5 μg of each protein sample. Migration positions of molecular mass standards of 66, 45, 31, and 21 kDa are indicated.
Figure 4
Figure 4
Effect of digitonin extraction on distribution of CLIC1 in Panc1 cells. Panc1 cells were fixed with PLP without (A, C) or with (B, D) prior extraction with digitonin. Cells were then stained with AP1089 (A, B) or with both AP1089 and 9F5 (C, D) and imaged using confocal microscopy. In A and B, images are shown from the very base of the cell (left panel) plus images at focal planes 2 (center) and 4 (right) μm higher. Collection of images in B required higher sensitivity than A. Parallel cultures stained with control antisera and imaged under identical conditions were blank (not shown). In panels C and D, cells were double stained with AP1089 with Alexafluor565-conjugated goat anti-rabbit IgG (red, left panel) and 9F5 with Alexafluor488-conjugated goat anti-mouse IgG (green, center panel) without (C) or following (D) digitonin extraction. A merged image for each pair is shown on the right. Scale bar in A and B represent 25 μm, scale bars in C and D represent 20 μm.
Figure 2
Figure 2
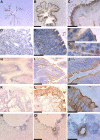
Staining of mouse frozen tissue sections for CLIC1. Each row displays images from a single tissue. The left column contains sections stained with control antibody, the center column contains matched sections stained with AP1089. Scale bars displayed with the center image apply to both the left and center images of that row. The right column presents a high power view of the corresponding tissue stained with AP1089. A, B. Esophagus imaged with 4× objective. Bar = 200 μm. C. Esophagus with 20× objective showing basal epithelial cell layer. Bar = 50 μm. D, E. Glandular stomach with 10× objective. Bar = 100 μm. F. Surface epithelium of glandular stomach with 40× objective. G. Subepithelial glands of glandular stomach with 40× objective. Bar = 20 μm, applies to both panel F and G. H, I. Small intestine (jejunum) with 20× objective. Bar = 50 μm. J. Small intestine with 60× objective. Bar = 20 μm. K, L: Colon with 20× objective. Bar = 50 μm. M. Colon with 60× objective. Bar = 20 μm. N, O. Liver with 20× objective. Bar = 50 μm. P. Liver with 60× objective, bar = 20 μm.
Figure 3
Figure 3
Staining of mouse frozen tissue sections for CLIC1. Images are arranged as in figure 2. A, B. Pancreas with 10× objective. Bar = 100 μm. C. Pancreatic duct from B with 40× objective. Bar = 20 μm. D, E. Lung with 4× objective. Bar = 200 μm. F. Airway epithelium as in E with 60× objective. Bar = 20 μm. G, H. Head of epididymis with 10× objective. Bar = 100 μm. I. Epithelial layer from head of epididymis as in H with 60× objective. Bar = 20 μm. J, K. Tail of epididymis with 10× objective. Bar = 100 μm. L. Tail of epididymis as in K with 40× objective. Bar = 20 μm. M, N. Skeletal muscle under 20× objective. Bar = 50 μm.
Figure 5
Figure 5
Digitonin extraction selectively removes soluble CLIC1 from Panc1 and T84 cells. Panc1 cells (A) or T84 cells (B) were grown to confluence. Parallel cultures were untreated (lanes 1 and 3) or extracted with digitonin (lanes 2 and 4) prior to homogenization and preparation of soluble (S) and membrane (M) fractions. Two micrograms of Panc1 soluble protein (A, lanes 1, 2), 8.5 μg of Panc1 membrane protein (A, lanes 3, 4), 2 μg of T84 soluble protein (B, lanes 1, 2), or 10 μg of T84 membrane protein (B, lanes 3, 4) were separated on SDS-PAGE, blotted and probed with AP1089 antibody.
Figure 6
Figure 6
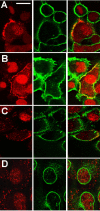
Colocalization of CLIC1 with markers of plasma membrane and nucleus following digitonin extraction. Panc1 cells were grown on glass coverslips and extracted with digitonin prior to PLP fixation and staining for CLIC1 (red) and subcellular compartment markers (green). The right column in each set is a merged image generated from the red (left column) and green (center column) channels. A, B. Two separate fields stained for CLIC1 (red) and Integrin α2 (green), a plasma membrane marker. C. Cells stained for CLIC1 (red) and Annexin2 (green), a plasma membrane marker. D. Cells stained for CLIC1 (red) and Nucleoporin p62 (green) a marker of nuclear envelope. The scale bar in panel A represents 20 μm and applies to all panels.
Figure 7
Figure 7
Differential extraction of CLIC1 from Panc1 Cells with digitonin and Triton X-100. Panc1 cells grown on glass coverslips were extracted with 0.004% (w/v) digitonin (A) or 0.5% (v/v) Triton X-100 (B) prior to fixation and staining for cytokeratin (green) and CLIC1 (red). The scale bar in each panel represents 10 μm.
Figure 8
Figure 8
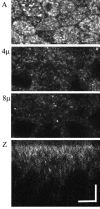
CLIC1 in T84 cells. Cells were grown to confluence on permeable supports, fixed, stained for CLIC1, and a stack of Z images at 0.2 μm intervals collected by confocal microscopy. A: image from the apex of the cells. 4μ: image taken 4 μm below image A. 8μ: image take 8 μm below image A. Z: vertical section generated from a 2 μm thick slice through the center of the stack of images. The scale bars represent 5 μm.
Figure 9
Figure 9
Redistribution of CLIC1 in T84 cells in response to forskolin. Confluent monolayers of T84 cells grown on filters were fixed directly (A) or pretreated with 10 μM forskolin in growth medium for 10 minutes prior to fixation (B). Cells were stained for CLIC1 and Z-section images created from 2 μm thick slices taken through stacks of confocal images taken at 0.2 μm intervals. Two representative Z-sections are shown from each specimen. The culture surface is at the bottom of each image, the apical surface of the cells at the top. Scale bar represents 10 μm.
Figure 10
Figure 10
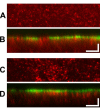
Effect of digitonin extraction on distribution of CLIC1 in T84 cells. Confluent T84 cell monolayers were stained with FITC-wheat germ agglutinin on ice, then either fixed directly (A, B) or following digitonin extraction (C, D). Cells were then stained for CLIC1 and confocal images obtained at 0.3 μm intervals. For both control (A, B) and digitonin extracted (C, D) samples, a red channel image from the focal plain with the most intense CLIC1 staining (panes A and C) and a merged Z-section generated from a 3.5 μm thick slice through the center of the stack of images (panes B and D) are shown.
Figure 11
Figure 11
Redistribution of digitonin-resistant CLIC1 in T84 Cells in response to forskolin. Normalized fluorescence intensity for FITC-WGA (closed symbols) or CLIC1 (open symbols) in control T84 cell monolayers (squares) or forskolin-treated monolayers (triangles), derived from stacks of confocal images and plotted as a function of the vertical distance from the peak of WGA. Data is averaged from three separate stacks derived from each monolayer.
Figure 12
Figure 12
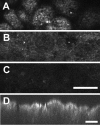
CLIC1 in MPTC cells. MPTC cell line was grown on collagen-coated filters, fixed, and stained with AP1089. Confocal images from the apical pole of the cell (A) and 5 microns (B) or 10 microns (C) below are shown. Scale bar represents 10 microns. D. Z section taken from a separate field along a single pixel line using 153 planes of focus covering 24 microns in depth. Scale bar represents 10 microns.
Figure 13
Figure 13
Colocalization of CLIC1 with megalin and NaPi-II in MPTC cells. MPTC cells were grown on collagen-coated filters, fixed, permeabilized, and stained for CLIC1 with the 9F5 monoclonal antibody (green, center column) and two markers of the apical endocytic/recycling compartment (red, left column). The right column in each set is a merged image generated from the red and green channels. A. Two separate fields from near the apical pole of the cells stained for megalin (red) and CLIC1 (green). B. Two separate field from near the apical pole of the cells stained for NaPi-II (red) and CLIC1 (green). The scale bars represent 10 microns in each set of images.

Similar articles

Cited by

References

    1. Nilius B, Droogman G. Amazing chloride channels: an overview. Acta Physiol Scand. 2003;177:119–147. doi: 10.1046/j.1365-201X.2003.01060.x. - DOI - PubMed
    1. Jentsch TJ, Maritzen T, Zdebik AA. Chloride channel diseases resulting from impaired transepithelial transport or vesicular function. J Clin Invest. 2005;115:2039–2046. doi: 10.1172/JCI25470. - DOI - PMC - PubMed
    1. Ashley RH. Challenging accepted ion channel biology: p64 and the CLIC family of putative intracellular anion channel proteins. Mol Membr Biol. 2003;20:1–11. doi: 10.1080/09687680210042746. - DOI - PubMed
    1. Cromer BA, Morton CJ, Board PG, Parker MW. From Glutathione transferase to a pore in a CLIC. Eur Biophys J. 2002;31:356–364. doi: 10.1007/s00249-002-0219-1. - DOI - PubMed
    1. Harrop SJ, DeMaere MZ, Fairlie WD, Reztsova T, Valenzuela SM, Mazzanti M, Tonini R, Qiu MR, Jankova L, Warton K, Bauskin AR, Wu WM, Pankhurst S, Campbell T, Breit SN, Cumi PM. Crystal structure of a soluble form of the intracellular chloride ion channel CLIC1 (NCC27) at 1.4-A resolution. J Biol Chem. 2001;276:44993–44500. doi: 10.1074/jbc.M107804200. - DOI - PubMed

Publication types