

Environmental and historical constraints on global patterns of amphibian richness
- PMID: 17327208
- PMCID: PMC2189569
- DOI: 10.1098/rspb.2006.0436
Environmental and historical constraints on global patterns of amphibian richness
Abstract
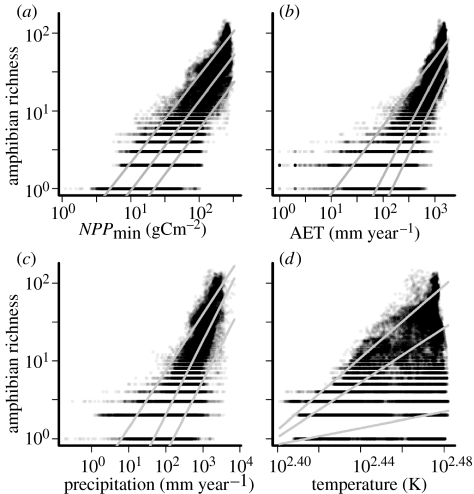
Our knowledge of the broad-scale ecology of vertebrate ectotherms remains very limited. Despite ongoing declines and sensitivity to environmental change, amphibian distributions are particularly poorly understood. We present a global analysis of contemporary environmental and historical constraints on amphibian richness, the first for an ectotherm clade at this scale. Amphibians are presumed to experience environmental constraints distinct from those of better studied endothermic taxa due to their stringent water requirements and the temperature dependence of their energetic costs and performance. Single environmental predictors set upper bounds on, but do not exclusively determine, amphibian richness. Accounting for differing regional histories of speciation and extinction helps resolve triangular or scattered relationships between core environmental predictors and amphibian richness, as the relationships' intercepts or slopes can vary regionally. While the magnitude of richness is strongly determined by regional history, within-region patterns are consistently jointly driven by water and temperature. This confirms that ecophysiological constraints extend to the broad scale. This coupling suggests that shifts in climatic regimes will probably have dramatic consequences for amphibians. Our results illustrate how the environmental and historical explanations of species richness gradients can be reconciled and how the perspectives are complements for understanding broad-scale patterns of diversity.
Figures


References
-
- Ahn C.H, Tateishi R. Development of a global 30-minute grid potential evapotranspiration data set. J. Jpn. Soc. Photogramm. Remote Sens. 1994;33:12–21.
-
- Allen A.P, Brown J.H, Gillooly J.F. Global biodiversity, biochemical kinetics, and the energetic-equivalence rule. Science. 2002;297:1545–1548. doi:10.1126/science.1072380 - DOI - PubMed
-
- Andrews A.P, Brown J.H, Gillooly J.F. Climate, vegetation, and predictable gradients in mammal species richness in southern Africa. J. Zool. 2002;251:205–231. doi:10.1111/j.1469-7998.2000.tb00605.x - DOI
-
- Anselin L. Kluwer; Dordrecht, The Netherlands: 1988. Spatial econometrics: methods and models.
-
- Araujo M.B, Thuiller W, Pearson R.G. Climate warming and the decline of amphibians and reptiles in Europe. J. Biogeogr. 2006;33:1712–1728.
Publication types
MeSH terms
LinkOut - more resources
Full Text Sources
