

Quantification of PERF 15 mRNA in tissue sections from rat testes
- PMID: 17327905
- PMCID: PMC1779950
- DOI: 10.1267/ahc.06016
Quantification of PERF 15 mRNA in tissue sections from rat testes
Abstract
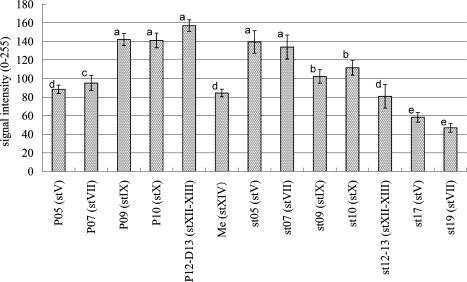
We previously conducted basic research to quantify in situ hybridization (ISH) signals in rat testes. In this experimental model, we selected ribosomal RNA (rRNA) as the hybridizable RNA in paraffin sections, since it allowed us to easily analyze ISH signals expressed with digoxygenin (DIG)-labeled probes quantitatively through "posterization" of the images. We applied this method to analyze the quantification of transcript, PERF 15 mRNA. PERF 15 is expressed specifically in the testes and localized in the rigid cytoskeletal structure of the sperm head, and has been considered to be involved in the apoptotic process of spermatogenic cells. Quantification of the signals may help to clarify the detailed function of PERF 15. We further analyzed the signals concomitant with a confocal laser scanning microscope. The peak of PERF 15 mRNA expression was found in diplotene spermatocytes, and the amount of PERF 15 mRNA was greatest in late pachytene and diplotene spermatocytes and early spermatids, followed by early pachytene spermatocytes, and then late spermatids. PERF 15 may be involved in the events leading to meiotic division, in which apoptosis is also involved. The present study may help to determine the concentration of mRNA in tissue sections.
Figures


Similar articles
-
Quantification of in situ hybridization signals in rat testes.J Histochem Cytochem. 2004 Jun;52(6):813-20. doi: 10.1369/jhc.4A6249.2004. J Histochem Cytochem. 2004. PMID: 15150290
-
Analysis of the protein composition of the mouse sperm perinuclear theca and characterization of its major protein constituent.Biol Reprod. 1997 Dec;57(6):1426-32. doi: 10.1095/biolreprod57.6.1426. Biol Reprod. 1997. PMID: 9408250
-
Nucleolar structure and synthetic activity during meiotic prophase and spermiogenesis in the rat.Am J Anat. 1990 Sep;189(1):1-10. doi: 10.1002/aja.1001890102. Am J Anat. 1990. PMID: 2239742
-
Expression of testicular fatty acid-binding protein PERF 15 during germ cell apoptosis.Dev Growth Differ. 2000 Aug;42(4):359-66. doi: 10.1046/j.1440-169x.2000.00520.x. Dev Growth Differ. 2000. PMID: 10969735
-
Expression of tumor necrosis factor-alpha in mouse spermatogenic cells.Endocrinology. 1993 Jul;133(1):389-96. doi: 10.1210/endo.133.1.8319585. Endocrinology. 1993. PMID: 8319585
Cited by
-
MeCP2 expression and promoter methylation of cyclin D1 gene are associated with cyclin D1 expression in developing rat epididymal duct.Acta Histochem Cytochem. 2008 Oct 29;41(5):135-42. doi: 10.1267/ahc.08025. Epub 2008 Oct 8. Acta Histochem Cytochem. 2008. PMID: 18989467 Free PMC article.
References
-
- Billig H., Furuta I., Rivier C., Tapanainen J., Parvinen M., Hsueh A. J. Apoptosis in testis germ cells: developmental changes in gonadotropin dependence and localization to selective tubule stages. Endocrinology. 1995;136:5–12. - PubMed
-
- Chomczynski P., Sacchi N. Single-step method of RNA isolation by acid guanidinium thiocyanate-phenol-chloroform extraction. Anal. Biochem. 1987;162:156–159. - PubMed
-
- Clermont Y., Einberg E., Leblond C., Wagner S. The perforatorium—an extension of the nuclear membrane of the rat spermatozoon. Anat. Rec. 1955;121:1–12. - PubMed
-
- Fujita H., Ogino T., Kobuchi H., Fujiwara T., Yano H., Akiyama J., Utsumi K., Sasaki J. Cell-permeable cAMP analog suppresses 6-hydroxydopamine-induced apoptosis in PC12 cells through the activation of the Akt pathway. Brain Res. 2006;1113:10–23. - PubMed
-
- Guiot Y., Rahier J. The effects of varying key steps in the non-radioactive in situ hybridization protocol: a quantitative study. Histochem. J. 1995;27:60–68. - PubMed
LinkOut - more resources
Full Text Sources
Other Literature Sources