

Protein buffering in model systems and in whole human saliva
- PMID: 17327922
- PMCID: PMC1803027
- DOI: 10.1371/journal.pone.0000263
Protein buffering in model systems and in whole human saliva
Abstract
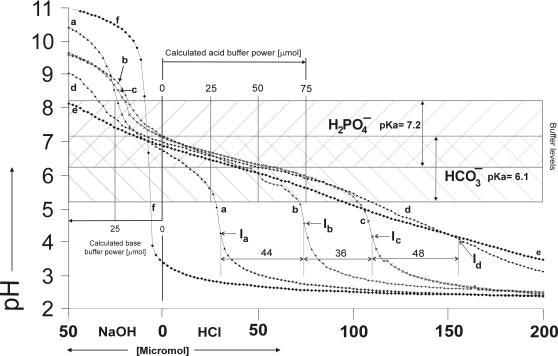
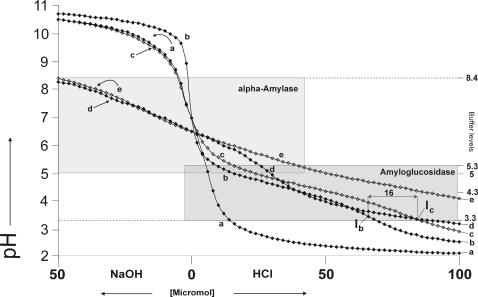
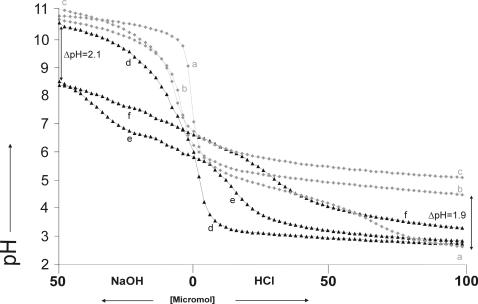
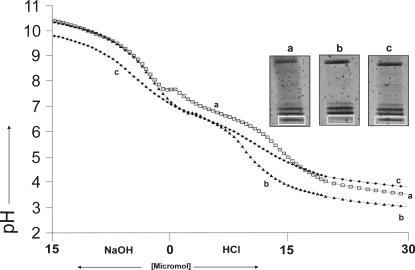
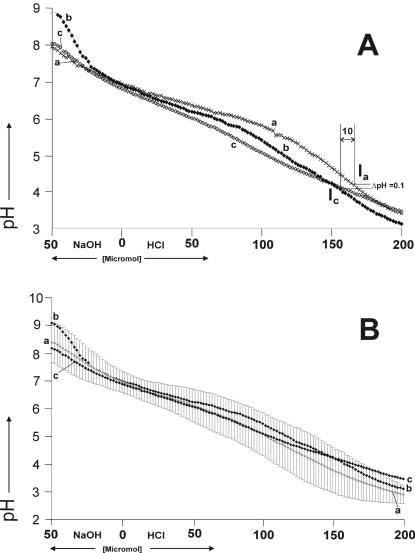
The aim of this study was to quantify the buffer attributes (value, power, range and optimum) of two model systems for whole human resting saliva, the purified proteins from whole human resting saliva and single proteins. Two model systems, the first containing amyloglucosidase and lysozyme, and the second containing amyloglucosidase and alpha-amylase, were shown to provide, in combination with hydrogencarbonate and di-hydrogenphosphate, almost identical buffer attributes as whole human resting saliva. It was further demonstrated that changes in the protein concentration as small as 0.1% may change the buffer value of a buffer solution up to 15 times. Additionally, it was shown that there was a protein concentration change in the same range (0.16%) between saliva samples collected at the time periods of 13:00 and others collected at 9:00 am and 17:00. The mode of the protein expression changed between these samples corresponded to the change in basic buffer power and the change of the buffer value at pH 6.7. Finally, SDS Page and Ruthenium II tris (bathophenantroline disulfonate) staining unveiled a constant protein expression in all samples except for one 50 kDa protein band. As the change in the expression pattern of that 50 kDa protein band corresponded to the change in basic buffer power and the buffer value at pH 6.7, it was reasonable to conclude that this 50 kDa protein band may contain the protein(s) belonging to the protein buffer system of human saliva.
Conflict of interest statement
Figures
References
-
- Lussi A, Jaeggi T, Zero D. The role of diet in the aetiology of dental erosion. Caries Res. 2004;(38 Suppl 1):34–44. - PubMed
-
- Zero DT, Lussi A. Of enamel erosion – Intrinsic and extrinsic factors. In: Addy M, Embery G, Edgar MRO, editors. Tooth wear and sensitivity. London: Martin Dunitz Ltd; 2000. pp. 121–139.
-
- Lussi A. Erosive tooth wear - a multifactorial condition of growing concern and increasing knowledge. Monogr Oral Sci. 2006;20:1–8. - PubMed
-
- Bargen J, Austin L. Decalcification of teeth as a result of obstipation with long continued vomiting. J Am Dent Assoc. 1937;24:1271–1273.
-
- Meurman JH, Toskala J, Nuutinen P, Klemetti E. Oral and dental manifestations in gastroesophageal reflux disease. Oral Surg Oral Med Oral Pathol. 1994;78:583–589. - PubMed
Publication types
MeSH terms
Substances
LinkOut - more resources
Full Text Sources
Research Materials
