. 2007 May;81(10):5079-90.
doi: 10.1128/JVI.02738-06. Epub 2007 Feb 28.

Intracellular Kaposi's sarcoma-associated herpesvirus load determines early loss of immune synapse components

Affiliations

Intracellular Kaposi's sarcoma-associated herpesvirus load determines early loss of immune synapse components

Laura A Adang et al. J Virol. 2007 May.

Abstract

Lifelong infection is a hallmark of all herpesviruses, and their survival depends on countering host immune defenses. The human gammaherpesvirus Kaposi's sarcoma-associated herpesvirus (KSHV) encodes an array of proteins that contribute to immune evasion, including modulator of immune recognition 2 (MIR2), an E3 ubiquitin ligase. Exogenously expressed MIR2 downregulates the surface expression of several immune synapse proteins, including major histocompatibility complex (MHC) class 1, ICAM-1 (CD54), and PECAM (CD31). Although immunofluorescence assays detect this lytic gene in only 1 to 5% of cells within infected cultures, we have found that de novo infection of naive cells leads to the downregulation of these immune synapse components in a major proportion of the population. Investigating the possibility that low levels of MIR2 are responsible for this downregulation in the context of viral infection, we found that MIR2 transduction recapitulated the patterns of surface downregulation following de novo infection and that both MIR2 promoter activation, MIR2 expression level, and immune synapse component downregulation were proportional to the concentration of KSHV added to the culture. Additionally, MIR2-specific small interfering RNA reversed the downregulation effects. Finally, using a sensitive, high-throughput assay to detect levels of the virus in individual cells, we also observed that downregulation of MHC class I and ICAM-1 correlated with intracellular viral load. Together, these results suggest that the effects of MIR2 are gene dosage dependent and that low levels of this viral protein contribute to the widespread downregulation of immune-modulating cell surface proteins during the initial stages of KSHV infection.


Figures

FIG. 1.
FIG. 1.
Patterns of PECAM, ICAM-1, and MHC-I downregulation were similar following either KSHV infection or MIR2 transfection of T4 TIME cells. To compare the patterns of downregulation between early infection with KSHV and MIR2 expression alone, surface expression of MHC-I, ICAM-1, and PECAM was analyzed. (A) Flow cytometric analysis of mock-infected or KSHV (MOI, 5)-infected T4 TIME cells. (B) Flow cytometry analysis of MIR2 retrovirus transduction. Gating was based on mock-treated conditions (UV-KSHV infection or vector alone). T4 TIME cells were stained for surface protein expression (MHC-I, ICAM-1, and PECAM) with the indicated antibodies 48 h after infection. The percentage of cells contained within each quadrant is shown in the corners of each scatter plot.
FIG. 2.
FIG. 2.
Dose-dependent activation of MIR2 promoter-luciferase constructs following de novo KSHV infection. To examine the dosage effects of KSHV infection on MIR2 promoter activity, cells transfected with MIR2 promoter constructs were infected with UV-inactivated KSHV or one of two concentrations of live virus. Promoter activity was measured at 24 h postinfection. (A) pMIR2-luciferase promoter constructs contained the regions −1,000, −800, −600, −400, and −200 bp from the MIR2 translational start site. (B) The luciferase activity levels are shown in duplicate (± range) at 24 h after exposure to UV-KSHV (pre-UV MOI of 5; black bars), KSHV (MOI of 2.5; white bars), or KSHV (MOI of 5; gray bars). Note the logarithmic y axis.
FIG. 3.
FIG. 3.
The dose-dependent activation of the ORF K5 promoter by KSHV infection correlates with MHC-I and ICAM-1 downregulation. Using a construct containing 1 kb upstream of the MIR2 transcriptional start site driving EGFP expression, expression of EGFP was compared to MHC-I and ICAM-1 expression in HeLa cells 48 h after KSHV infection. Flow cytometric analysis of EGFP (top), MHC-I (middle), and ICAM-1 (bottom). Cells were infected with increasing amounts of KSHV. KSHV with an MOI of 1 (left column), an MOI of 2 (center column), and an MOI of 3 (right column) are indicated by unfilled gray histograms. Mock-infected cells were incubated with UV-inactivated KSHV (black histograms). Shaded histograms represent the isotype antibody controls. Values shown in the upper-right-hand corner are percentages of cells from the infected population exhibiting EGFP upregulation or MHC-I/ICAM-1 downregulation.
FIG. 4.
FIG. 4.
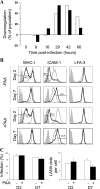
Surface molecule downregulation peaks early postinfection, despite persistent viral infection. To determine the time course of downregulation, HeLa cells were infected with KSHV and surface molecule levels were analyzed by flow cytometry at various time points. (A) KSHV-infected HeLa cells were analyzed for MHC-I and ICAM-1 surface levels at 0, 8, 16, 29, 42, and 66 h postinfection. Bars represent the percentages of cells that have downregulated MHC-I (white bars) or ICAM-1 (black bars) in the total cellular population and are from a representative experiment. (B) MHC-I, ICAM-1, and LFA-3 surface expression in HeLa cells 2 and 7 days postinfection. Results from representative experiments with or without PAA are shown; PAA (400 μM) was used to block virion production and subsequent reinfection in culture. Results for isotype antibody controls (solid gray histogram), mock infection (gray histogram), and KSHV infection (black histogram) are shown. (C) Persistence of viral infection was measured by IFA of LANA expression. The total percentage of infected cells (left graph) and average number of LANA dots per cell (right graph) at 2 and 7 days postinfection are shown. Values for cultures in the absence (white bars) and presence (black bars) of PAA are shown (n = 2 ± range).
FIG. 5.
FIG. 5.
Level of MIR2 expression correlates with degree of MHC-I and ICAM-1 downregulation and KSHV MOI. HeLa cells were transfected with vector alone or a full-length MIR2 construct containing a FLAG recognition site. MHC-I and ICAM-1 surface levels were measured at 24 h posttransfection. (A) MHC-1 and ICAM-1 surface expression are presented as histogram analyses for vector alone or the MIR2 total transfected population (ungated). (B) Expression of MHC-I and ICAM-1 for the three MIR2 expression gates, low, medium, and high, as based on detection by an anti-FLAG antibody. (C) Levels of MIR2 and alpha-tubulin proteins were compared in samples following infection with MOIs of 0, 10, 20, and 30 at 2 days after infection. This was compared to MIR2-transfected, uninfected cells as shown in the lane labeled MIR2 (24 h posttransfection).
FIG. 6.
FIG. 6.
Distinct sensitivity of MHC-I and ICAM-1 downregulation to intracellular viral load. MIFC was used to compare intracellular viral load (LANA dots) to levels of MHC-I and ICAM-1 surface expression. (A) MFIs of ICAM-1 and MHC-I were compared for cells containing 0, 1, 3, or ≥5 LANA dots (viral genome equivalents) per cell. Cells were harvested 2 days post-KSHV infection. Data are ratios of MFI ± ratio of SEM. (B) Representative images were selected showing cells containing 0, 1, 3, and ≥5 LANA dots per cells. Images include bright field (BF), ICAM-1 or MHC-I, LANA, and DRAQ5 nuclear dye (NUC).
FIG. 7.
FIG. 7.
MIR2-targeted siRNA reverses downregulation phenotype in infected HeLa cells. (A) Transfection of MIR2-specific siRNA led to a decrease in MIR2 protein, as shown by immunoblotting, at 48 h postinfection. Alpha-tubulin was used as a specificity and loading control. The left and right columns represent KSHV (MOI, 10)-infected cells that were transfected with either scramble (nonsense) or MIR2-specific siRNA, respectively. (B) In HeLa cells, MIR2 siRNA led to a loss of downregulation. Black lines are UV-infected cells, dotted lines are KSHV-infected plus scramble siRNA, and gray lines are KSHV-infected plus MIR2 siRNA. Isotype controls are represented by shaded histograms.
FIG. 8.
FIG. 8.
Role of MIR2-dependent downregulation in KSHV-infected pDMVEC cells. Primary dermal microvascular cells exhibited minimal downregulation and full reversion of MHC-I expression following infection with KSHV (MOI, 10) and MIR2 siRNA transfection. Following the same procedures, ICAM-1 exhibited strong downregulation in the majority of the population but only partial reversion with MIR2 siRNA. Black lines are UV-infected cells, dotted lines are KSHV-infected plus scramble siRNA, gray lines are KSHV-infected plus MIR2 siRNA. Isotype controls are represented by shaded histograms.

Similar articles

Cited by

References

    1. Adang, L. A., C. H. Parsons, and D. H. Kedes. 2006. Asynchronous progression through the lytic cascade and variations in intracellular viral loads revealed by high-throughput single-cell analysis of Kaposi's sarcoma-associated herpesvirus infection. J. Virol. 80:10073-10082. - PMC - PubMed
    1. Asahi-Ozaki, Y., Y. Sato, T. Kanno, T. Sata, and H. Katano. 2006. Quantitative analysis of Kaposi sarcoma-associated herpesvirus (KSHV) in KSHV-associated diseases. J. Infect. Dis. 193:773-782. - PubMed
    1. Ballestas, M. E., P. A. Chatis, and K. M. Kaye. 1999. Efficient persistence of extrachromosomal KSHV DNA mediated by latency-associated nuclear antigen. Science 284:641-644. - PubMed
    1. Blackbourn, D. J., E. Lennette, B. Klencke, A. Moses, B. Chandran, M. Weinstein, R. G. Glogau, M. H. Witte, D. L. Way, T. Kutzkey, B. Herndier, and J. A. Levy. 2000. The restricted cellular host range of human herpesvirus 8. AIDS 14:1123-1133. - PubMed
    1. Brander, C., P. O'Connor, T. Suscovich, N. G. Jones, Y. Lee, D. Kedes, D. Ganem, J. Martin, D. Osmond, S. Southwood, A. Sette, B. D. Walker, and D. T. Scadden. 2001. Definition of an optimal cytotoxic T lymphocyte epitope in the latently expressed Kaposi's sarcoma-associated herpesvirus kaposin protein. J Infect. Dis. 184:119-126. - PubMed

Publication types

MeSH terms

Substances